


Contents
Scroll to:
https://doi.org/10.25207/1608-6228-2025-32-2-15-28
Scroll to:
Background. Preterm prelabor rupture of membranes constitutes a pregnancy complication that accompanies preterm labor. Since this complication increases neonatal and maternal morbidity and mortality, it is relevant to conduct studies on the effect that the length of the latency period in preterm prelabor rupture of membranes has on the health status of the mother and child.
Objective. To identify risk factors for preterm prelabor rupture of membranes in order to predict complications in subsequent pregnancies (possibly with the use of artificial intelligence).
Methods. We conducted an observational cohort study examining the medical records of 82 pregnant women aged 18 to 43 years at 25–36 weeks of gestation diagnosed with preterm prelabor rupture of membranes (medical histories of pregnant women, labor records, and medical records of newborns). The study was conducted at the Perinatal Center of the Children’s Regional Clinical Hospital of the Ministry of Health of Krasnodar Krai. The medical records of pregnant women and newborns delivered in 2022–2023 were examined. A total of 1675 labor records were analyzed, of which 82 (4.9%) were selected as consistent with the “diagnosis of preterm prelabor rupture of membranes” (i.e., breaking of waters before 37 weeks). Depending on the length of the latency period, all subjects were divided into three groups: Group 1 (n = 35) with the latency period lasting from 12 to 24 hours; Group 2 (n = 8) with the latency period lasting from 24 to 48 hours; Group 3 (n = 39) with the latency period lasting from 48 hours and more. The study examined the anthropometric data of pregnant women and newborns, reproductive history, the course of current pregnancies, their outcomes, laboratory data, and the health status of newborns according to medical records. The statistical analysis was performed using Statistica 13.3 (Tibco, USA). The generally accepted level of statistical significance p = 0.05 was adopted.
Results. The most significant differences between the groups of patients with preterm prelabor rupture of membranes were observed in the number of smoking fathers, pregnancy duration, and endometrial echo on ultrasound after delivery. Such information provides a means to predict the course of subsequent pregnancies and can identify a group of patients in need of obstetric rehabilitation.
Conclusion. The analysis of somatic and reproductive history and the course of current pregnancies, as well as the assessment of neonatal health, served as the basis for developing a program for patients with a history of preterm prelabor rupture of membranes and in need of obstetric rehabilitation.
Atagoy S.S., Penzhoyan G.A., Karakhalis L.Yu. Cause and effect of preterm prelabor rupture of membranes during pregnancy: An observational cohort study. Kuban Scientific Medical Bulletin. 2025;32(2):15-28. https://doi.org/10.25207/1608-6228-2025-32-2-15-28
Preterm prelabor rupture of membranes (PPROM) constitutes a serious pregnancy complication that often accompanies preterm labor, contributing to neonatal and maternal morbidity and mortality [1–4]. According to the literature, PPROM incidence before 37 and 34 weeks of gestation amounts to 2–3% and less than 1%, respectively, i.e., it increases with increasing gestational age [5][6]. The obstetric community believes that it is extremely difficult to identify the main cause of PPROM. This is primarily attributed to a number of provoking factors. These factors include childhood infections, especially at the age of menstruation onset, age of pregnant women, history of abortions, history of inflammation, and other factors described in the literature [1][3][6]. However, few studies examine and compare risk factors for PPROM at different lengths of the latency period; they primarily focus on the gestational pathology, gestational infections, polyhydramnios, and multiple pregnancies [7].
Some works report that the normal course of pregnancy is related to the functional status of the respiratory system and that detected respiratory disorders lead to threatened miscarriage in 36% of pregnant women and cause inflammatory changes in fetal membranes; all this is accompanied by oligohydramnios in 8% and polyhydramnios in 18% of pregnant women1 [8][9]. However, it is not objective to consider only the mechanical causes of PPROM in the presence of polyhydramnios or only the infection factor leading to the inflammation of fetal membranes, which accompanies their preterm rupture. In identifying the causes of PPROM, it is necessary to take into account the effect of extragenital pathology in patients, as well as pregnancy complications. Current studies examine the effect of anemia on PPROM, which remains to be confirmed. In pregnant women aged over 30 years with respiratory diseases, these disorders are reported to affect the incidence of preterm labor, which amounts to 6.7% [10], and, as is well known, preterm labor is often accompanied by PPROM (in 40%)2 [8][9]. In this connection, the identification of PPROM risk factors in pregnant women constitutes an important task aimed at improving the health of both mothers and their children, which will undoubtedly have an impact on demographic indicators.
The study aims to identify preterm prelabor rupture of membranes risk factors for predicting complications in subsequent pregnancies with the use of artificial intelligence.
An observational cohort study was conducted. The study examined the medical records of 82 pregnant women aged 18 to 43 years at 25–36 weeks of gestation diagnosed with PPROM (medical histories of pregnant women, labor records, and medical records of newborns).
The study was conducted at the Perinatal Center of the Children’s Regional Clinical Hospital of the Ministry of Health of Krasnodar Krai. The medical records of pregnant women and newborns delivered in 2022–2023 were analyzed.
Inclusion criteria
Medical records of pregnant women aged 18 to 43 years (singleton pregnancy) and PPROM (latency period of over 12 hours) at 25 to 36 weeks of gestation (preterm labor).
Exclusion criteria
Medical records of pregnant women under 18 and over 45 years of age; with severe extragenital pathology; multiple pregnancies; fetal malformations; patients who became pregnant using assisted reproductive technologies.
Removal criteria
Medical records of pregnant women with a latency period of under 12 hours and patients whose records lacked the information necessary for the analysis.
Description of eligibility criteria (diagnostic criteria)
The selection of records involved establishing the PPROM diagnosis (i.e., breaking of waters before 37 weeks)3, as well as an analysis of the anthropometric parameters, medical and reproductive histories, and the course of current pregnancies.
Selection of group members
The eligibility criteria were used to select the medical records of pregnant women for the groups. A total of 1675 labor records were analyzed, of which 82 (4.9%) were selected as consistent with PPROM (i.e., breaking of waters before 37 weeks). In order to determine the effect of the length of the latency period on pregnant women, as well as to identify characteristic risk factors, all subjects were divided into three groups depending on the length of the latency period: Group 1 (n = 35) with the latency period lasting from 12 to 24 hours; Group 2 (n = 8) with the latency period lasting from 24 to 48 hours; Group 3 (n = 39) with the latency period lasting from 48 hours and more.
Main parameter in the study
The study determined differences in the body mass index (BMI, kg/m²), menstrual function (menstrual duration in days; menstrual cycle length in days; amount of blood loss as per NICE (National Institute for Health and Care Excellence), i.e., heavy or not heavy menstrual period; painfulness, i.e., the presence of pain requiring the use of painkillers; menstrual regularity, with the cycle normally lasting 24–38 days), the course of previous pregnancies and labors (number of all pregnancies; number of pregnancies that ended in childbirth, including preterm labor and cesarean sections, in artificial abortions, in spontaneous abortions, and in ectopic pregnancies), laboratory tests (complete blood count, urinalysis, and C-reactive protein), and endometrial echo (mm) as per ultrasound, i.e., the functional endometrial layer of the anterior and posterior walls of the uterine cavity and the cavity contents in the formed groups. The following parameters of newborns were evaluated: weight in grams, length in centimeters, and Apgar score in points at 1 and 5 minutes.
Additional parameters in the study
The additional study indicator served as a marker for further research into neural network models.
Methods for measuring the target parameters
In all the labor records of the patients selected for the study, the following data were analyzed: 1) anthropometric data (height and weight of pregnant women; BMI calculated as follows: weight in kg divided by height in meters squared; 2) reproductive history (age of first menstruation, or menarche, years old; duration of menstrual bleeding in days; menstrual cycle length, i.e., number of days from the first day of the period to the first day of the next period; amount of blood loss as per NICE [11], i.e., menstruation was considered heavy if it was necessary to change pads/tampons more often than every three hours, change pads at night, and in the presence of clots of over 2.5 cm in diameter; painfulness of the period, with the period considered to be painful if pain medication was used; regularity, which was determined by the length of the menstrual cycle lasting from 24 to 38 days); 3) the course of the current pregnancy and its outcomes; 4) laboratory data (complete blood count levels over time: red blood cell count, ×10¹²/L; white blood cell count, ×10⁹/L; hematocrit, %; hemoglobin, g/L; neutrophils ×10⁹/L; C-reactive protein, mg/L; specific gravity over time in the urinalysis). The studies were conducted using a MEK 6400 automated hematology analyzer (Nihon Seimitsu Sokki Co., Ltd., Japan) and a Roche Cobas 8000 modular analyzer (Roche, Switzerland). Ultrasound was performed using Flex Focus 1202 and ProFocus 2202 ultrasound systems (BK Medical ApS, Denmark). According to medical records, the following parameters of newborns were evaluated: weight in grams, length in centimeters, and Apgar score in points at 1 and 5 minutes.
Factors that could have skewed the results were initially considered as exclusion criteria and were not present in the analyzed patients.
Principles behind sample size determination
The sample size was not determined in advance.
Statistical methods
The statistical analysis was performed using Statistica 13.3 (Tibco, USA). In order to process data and achieve the stated aim, the arithmetic mean (M) and standard deviation (m) were calculated; subsequently, M ± m was used if the actual distribution followed the normal distribution; also, the median (Me) and lower and upper quantiles [ Q1, Q3] were calculated for ordinal numerical distributions or for quantitative parameters not satisfying the normal distribution. A comparison of groups according to quantitative measures for which the hypothesis of normal distribution was not rejected according to Kolmogorov–Smirnov tests was performed using the parametric Student’s t-test. When the experimental distribution did not follow the normal distribution, the study was conducted using the non-parametric the Kruskal-Wallis test. In order to compare the groups in terms of categorical indicators, multi-way contingency tables with Pearson’s chi-squared tests were used. The generally accepted level of statistical significance p = 0.05 was adopted4.
A total of 1675 labor records were analyzed, of which 82 (4.9%) PPROM patients were selected for the study (Fig. 1).
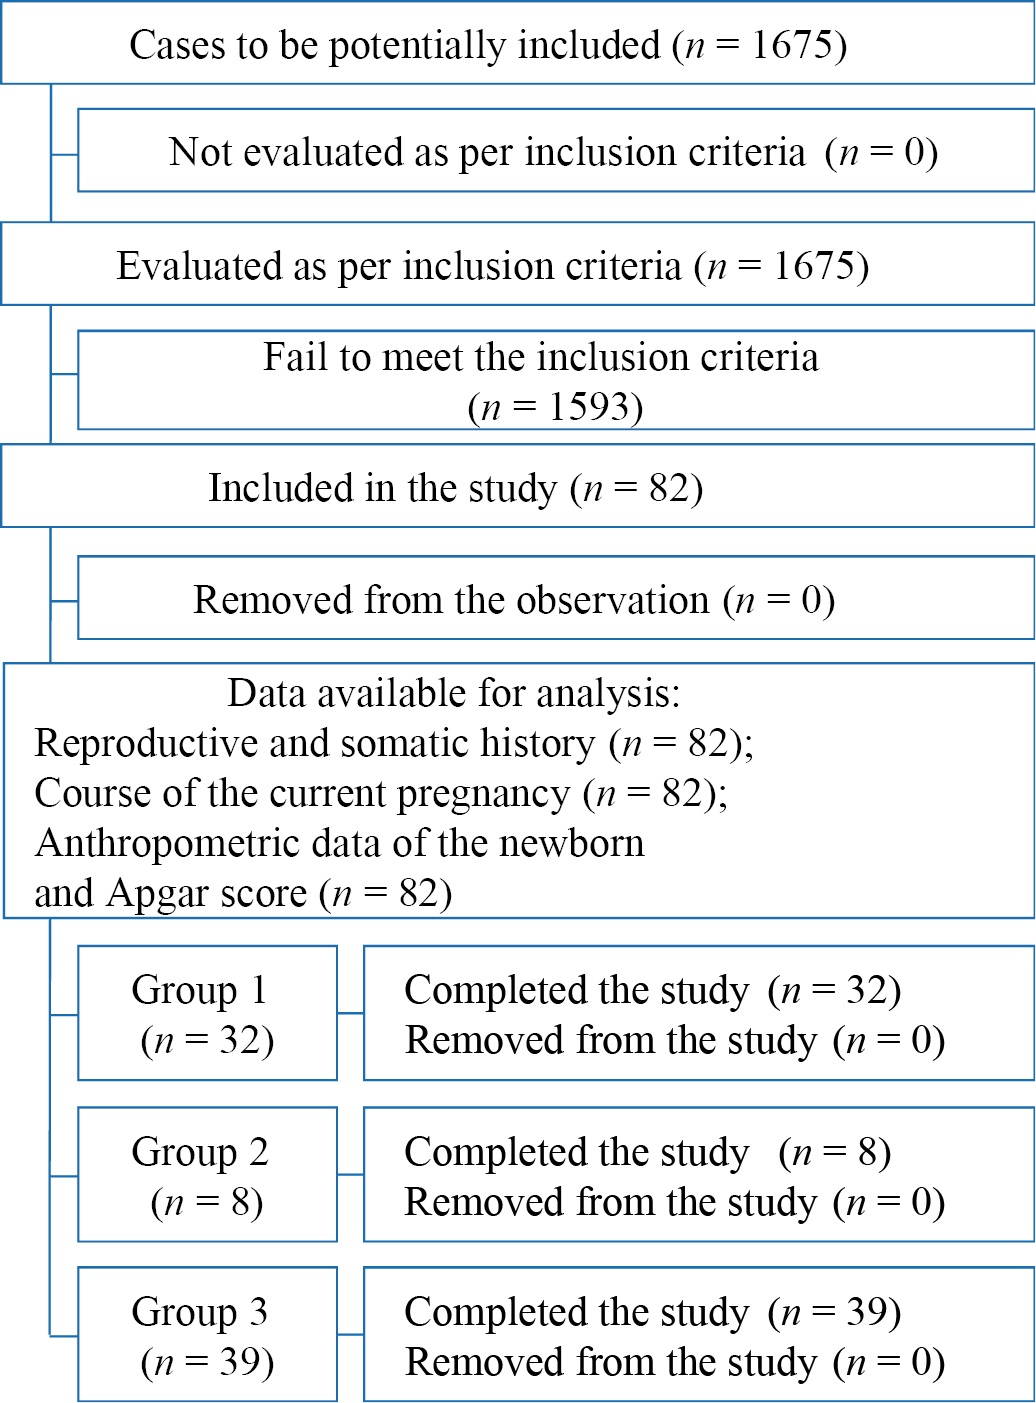
Fig. 1. Block diagram of the study design
Note: The block diagram was created by the authors (as per STROBE recommendations).
Рис. 1. Блок-схема дизайна исследования
Примечание: блок-схема выполнена авторами (согласно рекомендациям STROBE).
The Student’s t-test revealed no statistically significant age differences between all three groups (p > 0.05): the mean age was 28.86±6.27 years in Group 1, 32.63±4.50 years in Group 2, and 31.67±5.56 years in Group 3. No significant differences were found in the BMI: 26.38±5.59 kg/m² in Group 1, 26.41 ± 5.08 kg/m² in Group 2, and 25.98 ± 4.87 kg/m² in Group 3.
An analysis of menstrual function using the Kruskal-Wallis or Mann-Whitney U tests revealed no statistically significant median differences in terms of the age of menarche, menstrual duration, menstrual cycle length, or duration of infertility in the examined pregnant women (Table 1). No differences were found between the numbers of patients for the compared groups and in the number of pregnancies and deliveries, as well as in the incidence of preterm labor and the number of performed cesarean sections; the number of ectopic pregnancies, artificial and spontaneous abortions (Table 1). Noteworthy is that three patients (8.57%) with heavy menstrual periods were found in Group 1; no such patients were present in Group 2; only two Group 3 patients (5.13%) experienced heavy menstrual periods. Almost all the women had regular menstrual periods: 32 patients (91.43%) in Group 1, seven patients (87.5%) in Group 2, and 28 patients (71.79%) in Group 3. Painful menstruation was noted by three pregnant women (8.57%) in Group 1 and five patients (12.82%) in Group 3; no pregnant women experiencing painful menstruation were found in Group 2.
Table 1. Characteristics of reproductive history in the study groups; Me [ Q1; Q3]
Таблица 1. Характеристика репродуктивного анамнеза в группах исследования; Me [ Q1;Q3]
|
Characteristic |
Group 1 (n = 35) |
Group 1 (n = 8) |
Group 3 (n = 39) |
Level of statistical significance, p |
|
Menarche, years old |
13.0 [ 12.0; 14.0] |
13.0 [ 12.5; 14.0] |
13.0 [ 12.0; 14.0] |
p¹⁻² = 1.0 p¹⁻³ = 1.0 p²⁻³ = 1.0 |
|
Menstrual period, days |
5.0 [ 5.0; 5.0] |
4.5 [ 4.0; 5.5] |
5.0 [ 5.0; 5.0] |
p¹⁻² = 1.0 p¹⁻³ = 0.884 p²⁻³ = 1.0 |
|
Menstrual cycle, days |
28.0 [ 28.0; 28.0] |
28.0 [ 28.0; 28.0] |
28.0 [ 28.0; 30.0] |
p¹⁻² = 0.315 p¹⁻³ = 1.0 p²⁻³ = 0.455 |
|
Number of pregnancies |
2.0 [ 1.0; 4.0] |
2.5 [ 2.0; 3.0] |
2.0 [ 1.0; 4.0] |
p¹⁻² = 1.0 p¹⁻³ = 1.0 p²⁻³ = 1.0 |
|
Number of deliveries, absolute number |
1.0 [ 1.0; 3.0] |
2.0 [ 2.0; 2.5] |
2.0 [ 1.0; 3.0] |
p¹⁻² = 0.785 p¹⁻³ = 0.521 p²⁻³ = 1.0 |
|
Preterm labor, absolute number |
0.0 [ 0.0; 0.0] |
0.0 [ 0.0; 0.0] |
0.0 [ 0; 0] |
p¹⁻² = 1.0 p¹⁻³ = 1.0 p²⁻³ = 1.0 |
|
Cesarean section, absolute number |
0.0 [ 0.0; 0.0] |
0.0 [ 0.0; 0.5] |
0.0 [ 0.0; 1.0] |
p¹⁻² = 0.672 p¹⁻³ = 1.0 p²⁻³ = 1.0 |
|
Artificial abortions, absolute number |
0.0 [ 0.0; 0.0] |
0.0 [ 0.0; 0.5] |
0.0 [ 0.0; 0.0] |
p¹⁻² = 1.0 p¹⁻³ = 1.0 p²⁻³ = 1.0 |
|
Spontaneous abortions, absolute number |
0.0 [ 0.0; 1.0] |
0.0 [ 0.0; 0.5] |
0.0 [ 0.0; 1.0] |
p¹⁻² = 1.0 p¹⁻³ = 1.0 p²⁻³ = 1.0 |
|
Ectopic pregnancies, absolute number |
0.0 [ 0.0; 0.0] |
0.0 [ 0.0; 0.0] |
0.0 [ 0.0; 0.0] |
p¹⁻² = 1.0 p¹⁻³ = 1.0 p²⁻³ = 1.0 |
Notes: The table was compiled by the authors; p¹⁻² — level of statistical significance between the parameters of Groups 1 and 2; p¹⁻³ — level of statistical significance between the parameters of Groups 1 and 3; p²⁻³ — level of statistical significance between the parameters of Groups 2 and 3.
Примечания: таблица составлена авторами; р¹⁻² — уровень статистической значимости между значениями показателей для 1‑й и 2‑й групп; р¹⁻³ — уровень статистической значимости между значениями показателей для 1‑й и 3‑й групп; р²⁻³ — уровень статистической значимости между значениями показателей для 2‑й и 3‑й групп.
An analysis of data presented in Table 1 shows no statistically significant difference between the groups in terms of reproductive health indicators (menstrual cycle characteristics; number of pregnancies and their outcomes). Also, no significant differences were found between the clinical groups in the number of prior acute respiratory virus infections (ARVIs). A comparison of the PPROM groups in terms of the number of prior ARVIs yielded a Kruskal-Wallis significance level of p = 1.0, i.e., p > 0.05.
Statistically significant differences were found between Group 1 (less than 24 hours) and Group 3 (48 hours or more) in the median pregnancy duration (p = 0.024); no significant differences were observed between Group 1 (less than 24 hours) and Group 2 (from 24 to 48 hours) (p = 1.0) and between Group 2 (from 24 to 48 hours) and Group 3 (48 hours or more) (p = 0.781) (Fig. 2).
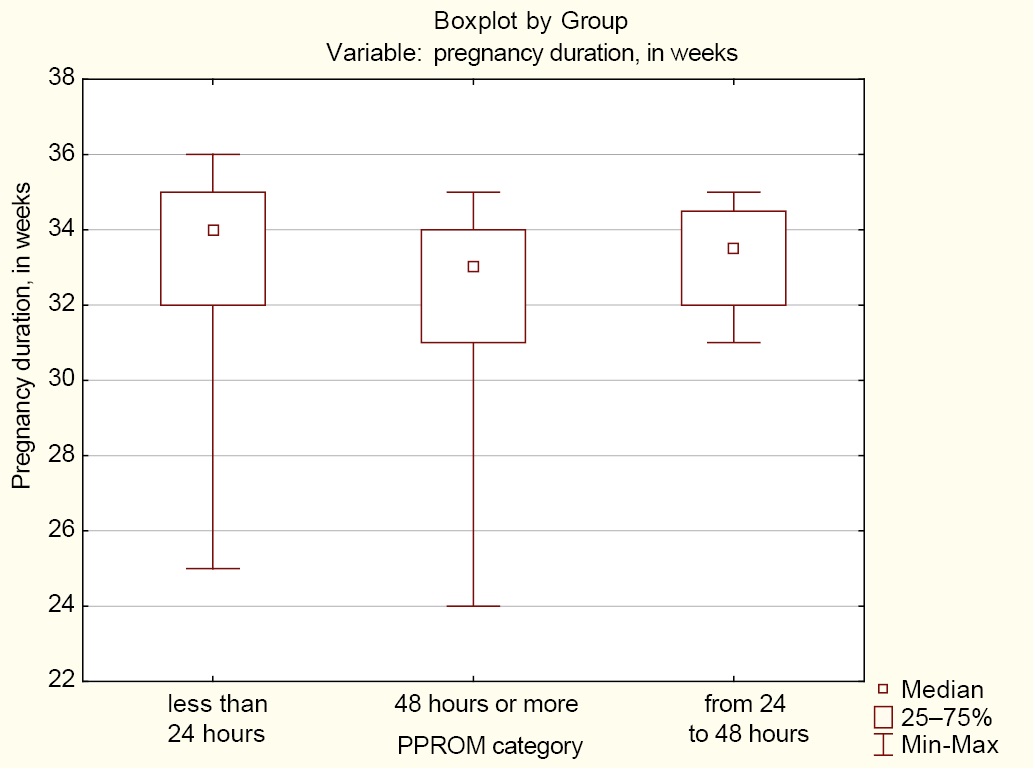
Fig. 2. Median pregnancy duration in the groups of women with preterm prelabor rupture of membranes
Notes: The figure was created by the authors; Group 1 (less than 24 hours); Group 2 (from 24 to 48 hours); Group 3 (48 hours or more). Abbreviation: PPROM — preterm prelabor rupture of membranes.
Рис. 2. Медианные значения сроков родов в группах при преждевременном разрыве плодных оболочек
Примечание: рисунок выполнен авторами; менее 24 — группа 1; от 24 до 48 — группа 2; от 48 — руппа 3. Сокращение: PPROM — преждевременный разрыв плодных оболочек.
Thus, while the proportions of women with and without a previous history of chickenpox in Group 1 (less than 24 hours) are 94.29 and 5.71%, respectively, these proportions in Group 3 (48 hours or more) are 79.49 and 20.51% respectively. An even greater difference was found in Group 2 (from 24 to 48 hours), with 62.50% having a previous history of chickenpox and 37.50% having no previous history of chickenpox (Table 2). The differences in proportions between the groups are statistically significant (p = 0.025).
Table 2. Number of patients having a previous history of chickenpox and their proportion in the groups with preterm prelabor rupture of membranes
Таблица 2. Количество пациентов с перенесенной ветряной оспой и их доля в группах с преждевременным разрывом плодных оболочек
|
Groups |
Pregnant women with a previous history of chickenpox (n / %) |
Pregnant women with no previous history of chickenpox (n / %) |
Total in the group (n / %) |
|
Group 1 (n = 35) |
33 / 94.29 |
2 / 5.71 |
35 / 100 |
|
Group 2 (n = 8) |
5 / 62.50 |
3 / 7.50 |
8 / 100 |
|
Group 3 (n = 39) |
31 / 79.49 |
8 / 20.51 |
39 / 100 |
|
Total for all the groups |
69 |
13 |
82 |
|
As per chi-squared test |
p = 0.047 |
||
Note: The table was compiled by the authors.
Примечание: таблица составлена авторами.
A prevalence analysis of somatic pathologies among the examined pregnant women revealed no significant relationships between the PPROM groups and the prevalence rate of cardiovascular diseases, arterial hypertension, inherited thrombophilias, gastrointestinal diseases, endocrine diseases, including hypothyroidism and Type 2 diabetes associated with excess weight and obesity, musculoskeletal diseases, neurological diseases, skin conditions, and breast pathologies.
In Group 1, the pregnant women had no respiratory diseases; a slightly higher proportion of women with respiratory diseases and a lower proportion of those who had no respiratory diseases was noted in Group 3, 7.69 and 92.31%, respectively; a significantly higher proportion of those who had respiratory diseases and lower proportion of those had no respiratory diseases was found in Group 2, 25 and 75% respectively (Table 3). The difference in proportions between the groups is statistically significant (p = 0.025).
Table 3. Number of patients with respiratory diseases and their proportion in the groups of patients with preterm prelabor rupture of membranes
Таблица 3. Количество пациентов с заболеваниями дыхательной системы и их доля в группах с преждевременным разрывом плодных оболочек
|
Groups |
With respiratory diseases (n / %) |
Without respiratory diseases (n / %) |
Total in the group (n / %) |
|
Group 1 (n = 35) |
35 / 100.00 |
0 / 0.00 |
35 / 100 |
|
Group 2 (n = 8) |
6 / 75.00 |
2 / 25.00 |
8 / 100 |
|
Group 3 (n = 39) |
36 / 92.31 |
3 / 7.69 |
39 / 100 |
|
Total for all the groups |
77 |
5 |
82 |
|
As per chi-squared test |
p = 0.025 |
||
Note: The table was compiled by the authors.
Примечание: таблица составлена авторами.
The normal course of pregnancy is known to depend directly on the functional status of the respiratory system. Respiratory diseases lead to threatened miscarriage in 36% of pregnant women, cause inflammatory changes in fetal membranes, and contribute to oligohydramnios in 8% and polyhydramnios in 18% of pregnant women5 [8][9]. Of note is that pregnant women with respiratory diseases are generally aged over 30 years; the incidence of preterm labor amounts to 6.7%, which does not depend on the severity of the course of respiratory diseases [10].
A statistically significant difference in the number of smoking pregnant women was also found between the PPROM groups. The personal history revealed that 8.57% of pregnant women in Group 1 and 5.13% in Group 3 had a smoking habit; however, a significantly higher number of smokers were present in Group 2, 37.5% (Table 4). The difference in proportions between the groups is statistically significant (p = 0.019).
Table 4. Number of smoking pregnant women and their proportion in the groups with preterm prelabor rupture of membranes
Таблица 4. Количество курящих беременных и их доля в группах с преждевременным разрывом плодных оболочек
|
Groups |
Non-smokers (n / %) |
Smokers (n / %) |
Total in the group (n / %) |
|
Group 1 (n = 35) |
32 / 91.43 |
3 / 8.57 |
35 / 100 |
|
Group 2 (n = 8) |
5 / 62.50 |
3 / 37.50 |
8 / 100 |
|
Group 3 (n = 39) |
37 / 94.87 |
2 / 5.13 |
39 / 100 |
|
Total for all the groups |
74 |
8 |
82 |
|
As per chi-squared test |
p = 0.019 |
||
Note: The table was compiled by the authors.
Примечание: таблица составлена авторами.
The medical history of partners (fathers) in terms of smoking showed a significant relationship between clinical PPROM groups and paternal smoking (Table 5). The differences in proportions between the groups are statistically significant (p = 0.013).
Table 5. Number of smoking partners (fathers) and their proportion in the groups with preterm prelabor rupture of membranes
Таблица 5. Количество курящих партнеров (отцов ребенка) и их доля в группах с преждевременным разрывом плодных оболочек
|
Groups |
Non-smokers (n / %) |
Smokers (n / %) |
Total in the group (n / %) |
|
Group 1 (n = 35) |
24 / 68.57 |
11 / 31.43 |
35 / 100 |
|
Group 2 (n = 8) |
6 / 75.00 |
2 /25.00 |
8 / 100 |
|
Group 3 (n = 39) |
37 / 94.87 |
2 / 5.13 |
39 / 100 |
|
Total for all the groups |
67 |
15 |
82 |
|
As per chi-squared test |
p = 0.013 |
||
Note: The table was compiled by the authors.
Примечание: таблица составлена авторами.
As Table 5 shows, the lowest number of smoking fathers was found in Group 3 (5.13%); their percentage in Groups 2 and 1 was higher (25% and 31.43%, respectively).
A comparison of the data presented in Tables 4 and 5 shows that the intensity of smoking among fathers and mothers with PPROM is different. According to Radzinsky et al., smoking increases the incidence of threatened miscarriage both in smokers and in those who quit smoking during pregnancy by 1.8 to 3 times6 [12][13], which contributes to PPROM.
The prevalence of allergy among pregnant women in all clinical groups was analyzed: 5.71% (2) of pregnant women in Group 1, 12.5% (1) in Group 2, and 10.26% (4) in Group 3. The presence of allergens impairs adaptation mechanisms and may contribute to both threatened miscarriage and the manifestation of respiratory diseases and contribute to PPROM, while some authors believe that this factor does not affect the course of pregnancy7 [14][15].
An analysis of gynecologic pathologies in the groups of pregnant women revealed 12 patients (34.29%) in Group 1 and 13 patients (33.33%) in Group 3 with benign cervical diseases, while in Group 2 this pathology was not present. In Group 3, a total of five women (12.8%) had a history of cervical conization for moderate dysplasia, which contributes to PPROM [16]. In addition, the prevalence of the following gynecologic pathologies was analyzed in the groups: uterine fibroids, genital endometriosis, polycystic ovary syndrome, pelvic inflammatory diseases, sexually transmitted infections, bacterial vaginosis, cervicitis and vaginitis, infertility rate, and number of pelvic surgeries. Gynecologic pathologies were found in 19 pregnant women (54.29%) in Group 1, six women (75.0%) in Group 2, and 23 women (58.97%) in Group 3. The infectious causes of PPROM are predictable and preventable, which is the basis for creating an algorithm for the management of this cohort of patients after delivery.
As noted above, all of the women conceived without the use of assisted reproductive technologies. Special attention is paid to the course of current pregnancies in the clinical groups. During pregnancy, the exacerbation of urinary tract infections was noted in nine women (25.71%) in Group 1, one woman (12.5%) in Group 2, and eight women (20.51%) in Group 3. Vulvovaginal candidiasis accompanied pregnancy in three patients (8.57%) in Group 1 and seven patients (17.95%) in Group 3. Bacterial vaginosis was found in all three groups: in three women (8.57%) in Group 1, two women (25.0%) in Group 2, and also in three women (7.69%) in Group 3. The prevalence of vaginitis was almost equal in all groups: four women (11.43%) in Group 1, one woman (10.26%) in Group 2, and also four women (10.26%) in Group 3.
Noteworthy is that the overall prevalence of diseases during the current pregnancy was high, yet without a statistical difference between the groups: 25 women (71.43%) in Group 1, six women (75.0%) in Group 2, and 33 women (84.62%) in Group 3, which indicates an unfavorable backdrop for current pregnancies, which ended in PPROM.
The severity of anemia plays a major role in prolonging pregnancy [17]. The study showed that its prevalence rate amounted to 25.71% (nine women) in Group 1, 37.5% (three women) in Group 2, and 43.59% (17 women) in Group 3. The presence of anemia in every third (29 pregnant women, 35.4%) of all the examined pregnant women increases the risks of PPROM, which was noted by Belotserkovtseva et al. [18].
The prevalence of gestational diabetes mellitus (GDM) in the current pregnancies amounted to 25.64% (ten women) in Group 3 and 14.29% (five women) in Group 1; no GDM was observed in Group 2. Gestational diabetes mellitus was found in 18.3% (15 women) of all pregnant women with PPROM, that is, one in five pregnant women with PPROM suffered from GDM.
Nearly half of the pregnant women in Group 1 (i.e., 15 women or 42.86%) and over half of the patients in Group 3 (i.e., 22 women or 56.41%) were diagnosed with threatened miscarriage; in Group 2, threatened miscarriage was less common (two women or 25.0%). In the first trimester, threatened miscarriage was most commonly observed in Group 3: in 18 pregnant women (46.15%), with a significant difference found between Groups 1 and 3 (p = 0.025) and between Groups 2 and 3 (p = 0.023). Thus, the higher the rate of threatened miscarriage in the first trimester, the longer the latency period. In the second trimester, threatened miscarriage was more common in Group 1, i.e., in seven pregnant women (20.0%), while in the third trimester, as well as in the first trimester, it was more common in Group 3, i.e., in six pregnant women (15.38%). Thus, the threatened miscarriage at different gestational periods was more common in Group 3 patients (with a latency period length of 48 hours or more). A total of 22 pregnant women (26.8%) received inpatient treatment for threatened miscarriage. Noteworthy is that cervical insufficiency was observed among pregnant women in Groups 1 and 3: four patients (11.43%) in Group 1 and six patients (15.38%) in Group 3. In all the groups, pregnancy was accompanied by arterial hypertension in four patients (4.9%), gestational pyelonephritis in five patients (6.1%), and chronic placental insufficiency with hemodynamic compromise in 16 patients (19.5%) of all pregnant women.
The complete blood count, urinalysis, and C-reactive protein (CRP) levels were analyzed. Blood levels on admission and after delivery were compared (Table 6). In most cases, the changes were statistically significant according to the Wilcoxon signed-rank test (p < 0.05). Table 6 shows a post-delivery decrease in the absolute levels of white blood cell count (Group 1, p < 0.001; Group 2, p = 0.017; Group 3, p < 0.001), red blood cell count (Group 1, p = 0.051; Group 2, p = 0.327; Group 3, p = 0.001), hemoglobin (Group 1, p = 0.021; Group 2, p = 0.327; Group 3, p = 0.001), hematocrit (Group 1, p = 0.087; Group 2, p = 0.484; Group 3, p = 0.012), and neutrophils (Group 1 p < 0.001; Group 2, p = 0.017; Group 3, p < 0.001) in all the groups. Of note is that the CRP levels increased in all the groups after delivery (Group 1, p < 0.001; Group 2, p = 0.025; Group 3, p = 0.001).
Table 6. Mean blood count levels (M ± m) in the study groups prior to and after delivery
Таблица 6. Средние значения (M ± m) показателей крови в группах исследования до и после родов
|
Parameter |
Group 1 (n = 35) |
Group 2 (n = 8) |
Group 3 (n = 39) |
|||
|
prior to delivery |
after delivery |
prior to delivery |
after delivery |
prior to delivery |
after delivery |
|
|
White blood cell count, ×10⁹/L |
12.68 ± 3.41 |
9.79 ± 1.84* |
12.97 ± 4.08 |
9.64 ± 1.67** |
13.90 ± 3.45 |
10.38 ± 2.99* |
|
Red blood cell count, ×10¹²/L |
3.96 ± 0.39 |
3.81 ± 0.45** |
3.83 ± 0.40 |
3.70 ± 0.53 |
3.85 ± 0.36 |
3.55 ± 0.51** |
|
Hemoglobin, g/L |
115.54 ± 12.21 |
111.0 ± 14.16** |
115.63 ± 15.47 |
110.38 ± 17.20 |
115.28 ± 11.15 |
106.36 ± 18.33** |
|
Hematocrit, % |
34.22 ± 3.16 |
33.21 ± 4.16 |
33.83 ± 3.85 |
32.49 ± 5.51 |
33.66 ± 2.82 |
31.47 ± 5.37** |
|
Neutrophils, ×10⁹/L |
16.78 ± 18.08 |
7.64 ± 1.79* |
11.68 ± 3.99 |
6.73 ± 1.64** |
11.51 ± 3.98 |
11.51 ± 3.98* |
|
CRP, mg/L |
9.94 ± 7.20 |
39.51 ± 3.79* |
8.61 ± 3.50 |
31.76 ± 20.50** |
10.63 ± 8.88 |
29.14 ± 28.11** |
Notes: The table was compiled by the authors; significance of differences between the parameters prior to and after delivery: * p < 0.001; ** p < 0.05. Abbreviations: CRP — C-reactive protein.
Примечания: таблица составлена авторами; уровень значимости различий между значениями показателей до и после родов: * p < 0,001; ** p < 0,05. Сокращение: CRP — С-реактивный белок.
An analysis of complete blood count levels with the use of the Kruskal—Wallis test revealed a statistically significant difference in the urine specific gravity after delivery between Group 1 (less than 24 hours) and Group 2 (from 24 to 48 hours) (p = 0.026), which was not observed on admission (Fig. 3).
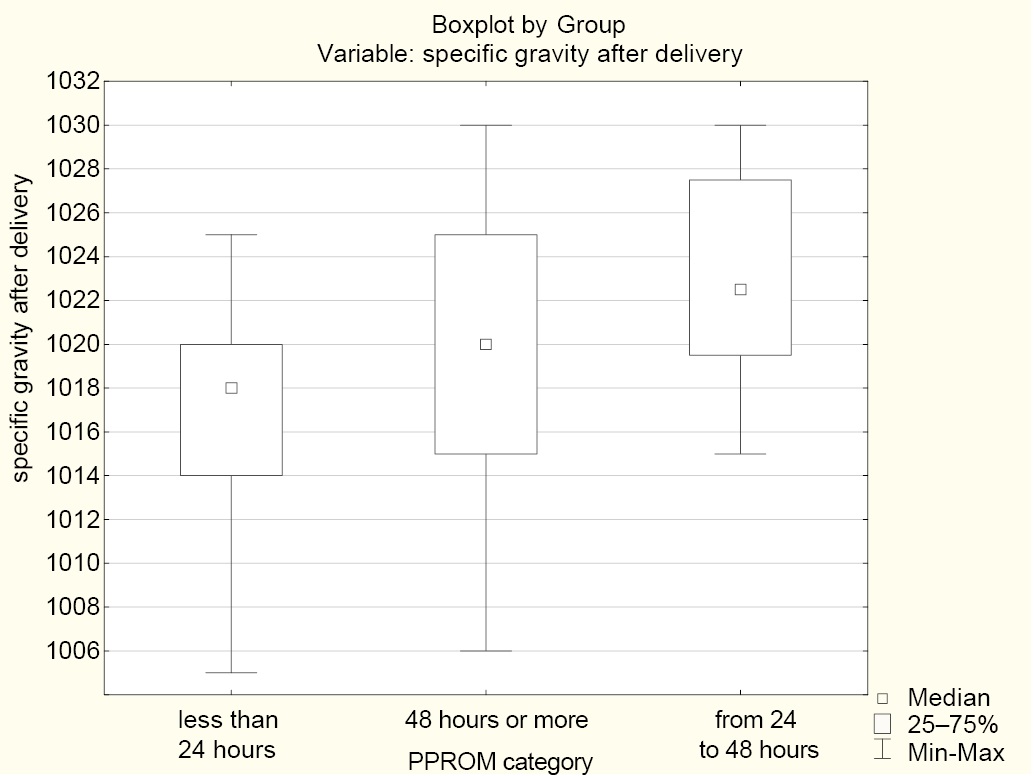
Fig. 3. Median urine specific gravity after delivery in the groups
Notes: The figure was created by the authors; Group 1 (less than 24 hours); Group 2 (from 24 to 48 hours); Group 3 (48 hours or more). Abbreviation: PPROM — preterm prelabor rupture of membranes.
Рис. 3. Медианные значения удельного веса мочи после родов в группах
Примечания: рисунок выполнен авторами; менее 24 — группа 1; от 24 до 48 — группа 2; от 48 и более — группа 3. Сокращение: PPROM — преждевременный разрыв плодных оболочек.
While the specific gravity values in Groups 1 and 3 were stable (an insignificant decrease), Group 2 exhibited a specific gravity increase from 1016.88 ± 2.59 to 1023.00 ± 5.40. This can be attributed to the generation of ketoacid or protein in inflammation, which is accompanied by a CRP level increase (Table 6).
Noteworthy is that antibiotics were prescribed to all pregnant women in Group 3 (latency period of 48 hours or more) and Group 2 (latency period of 24 to 48 hours), while in Group 1, antibiotics were prescribed to only seven pregnant women (20.0%), which may have affected the CRP level exhibiting a statistically significant increase after delivery.
An important method used to characterize the postpartum state of the uterine cavity is an ultrasound examination, in which endometrial echo is analyzed. Endometrial echo was measured on the third day of the postpartum period in different parts of the uterine cavity: upper third, middle third, and lower third. The obtained data are presented in Table 7.
Table 7. Endometrial echo (M ± m) of the uterine cavity (as per ultrasound)
Таблица 7. Показатели М-эха (M ± m) полости матки (по данным ультразвукового исследования)
|
Endometrial echo |
Group 1 (n = 35) |
Group 2 (n = 8) |
Group 3 (n = 39) |
Level of statistical significance, р |
|
Upper third of the uterine cavity, mm |
7.37 ± 1.33 |
7.75 ± 3.15 |
6.26 ± 2.23 |
p¹⁻² = 1.0 p¹⁻³ = 0.012 p²⁻³ = 0.172 |
|
Middle third of the uterine cavity, mm |
8.29 ± 0.87 |
9.5 ± 3.74 |
7.66 ± 2.66 |
p¹⁻² = 1.0 p¹⁻³ = 0.598 p²⁻³ = 0.351 |
|
Lower third of the uterine cavity, mm |
10.34 ± 5.62 |
11.5 ± 3.59 |
8.84 ± 2.64 |
p¹⁻² = 0.633 p¹⁻³ = 0.774 p²⁻³ = 0.157 |
Notes: p¹⁻² — level of statistical significance between the parameters of Groups 1 and 2; p¹⁻³ — level of statistical significance between the parameters of Groups 1 and 3; p²⁻³ — level of statistical significance between the parameters of Groups 2 and 3.
Примечания: р¹⁻² — уровень статистической значимости между значениями показателей для 1‑й и 2‑й групп; р¹⁻³ — уровень статистической значимости между значениями показателей для 1‑й и 3‑й групп; р²⁻³ — уровень статистической значимости между значениями показателей для 2‑й и 3‑й групп.
The data presented in Table 7 and their analysis indicate that the groups are mostly homogeneous (similar) in terms of quantitative and qualitative indicators. Postpartum subinvolution of the uterus was present in 8.53% (7) of all the examined women, with no statistical difference observed between the groups, and lochiometra was found in 15.85% (13) of the patients, also with no significant statistical difference between the groups.
The publicly available studies report data on the status of fetuses and newborns in PPROM [18]. Preterm prelabor rupture of membranes is shown to have an impact on the health status of newborns: these are low birth weight newborns; the longer the latency period was, the lower weight was recorded after birth. A health status assessment of newborns by groups (Table 8) showed no particular difference in the birth weight and length between the groups, with the newborns having low birth weight (Me of weight in all groups was below 2500 g), which became lower with the increasing length of the latency period. The average Apgar score at 1 and 5 minutes did not exceed 7.5 and 8 points, respectively, which naturally complicates the neonatal period, often manifesting as neonatal pneumonia.
Table 8. Health status assessment of newborns in the study groups
Таблица 8. Оценка состояния новорожденных в исследуемых группах
|
Parameter |
Group 1 (n = 35) |
Group 2 (n = 8) |
Group 3 (n = 39) |
Level of statistical significance, р |
|
Weight, g (M ± m) |
2208.29 ± 745.28 |
2146.25 ± 562.75 |
1923.08 ± 612.78 |
p¹⁻² = 1.0 p¹⁻³ = 0.081 p²⁻³ = 0.720 |
|
Length, cm (M ± m) |
44.11 ± 6.71 |
44.25 ± 4.56 |
43.80 ± 4.83 |
p¹⁻² = 1.0 p¹⁻³ = 1.0 p²⁻³ = 1.0 |
|
Apgar score at 1 minute, in points (Me [ Q1; Q3]) |
6.0 [ 5.0; 8.0] |
7.5 [ 6.5; 8.0] |
7.0 [ 6.0; 8.0] |
p¹⁻² = 0.322 p¹⁻³ = 0.601 p²⁻³ = 1.0 |
|
Apgar score at 5 minutes, in points (Me [ Q1; Q3]) |
7.0 [ 6.0; 8.0] |
8.0 [ 7.0; 8.0] |
7.0 [ 7.0; 8.0] |
p¹⁻² = 0.568 p¹⁻³ = 0.962 p²⁻³ = 1.0 |
Notes: p¹⁻² — level of statistical significance between the parameters of Groups 1 and 2; p¹⁻³ — level of statistical significance between the parameters of Groups 1 and 3; p²⁻³ — level of statistical significance between the of parameters for Groups 2 and 3.
Примечание: р¹⁻² — уровень статистической значимости между значениями показателей для 1‑й и 2‑й групп; р¹⁻³ — уровень статистической значимости между значениями показателей для 1‑й и 3‑й групп; р²⁻³ — уровень статистической значимости между значениями показателей для 2‑й и 3‑й групп.
No statistically significant differences were found between the groups in the incidence of pneumonia in newborns: 54.29% in Group 1 (19 children), 37.5% in Group 2 (three children), and 43.59% in Group 3 (17 newborns), with a total of 39 children (47.56%) diagnosed with pneumonia. Thus, despite the antibiotic therapy, the incidence of neonatal pneumonia was high, which required postnatal efforts on the part of neonatologists to resolve the disease and rehabilitate the newborns.
An additional result of the study was the creation of a predictive model using neural networks. Using the data obtained in this study as a basis, we created a neural network model (Fig. 4) that helps to predict the course of subsequent pregnancies and identify a group of patients in need of obstetric rehabilitation. It is known that prior PPROM significantly increases the incidence of this pathology in subsequent pregnancies [16]; therefore, a plan of preventive measures is required.
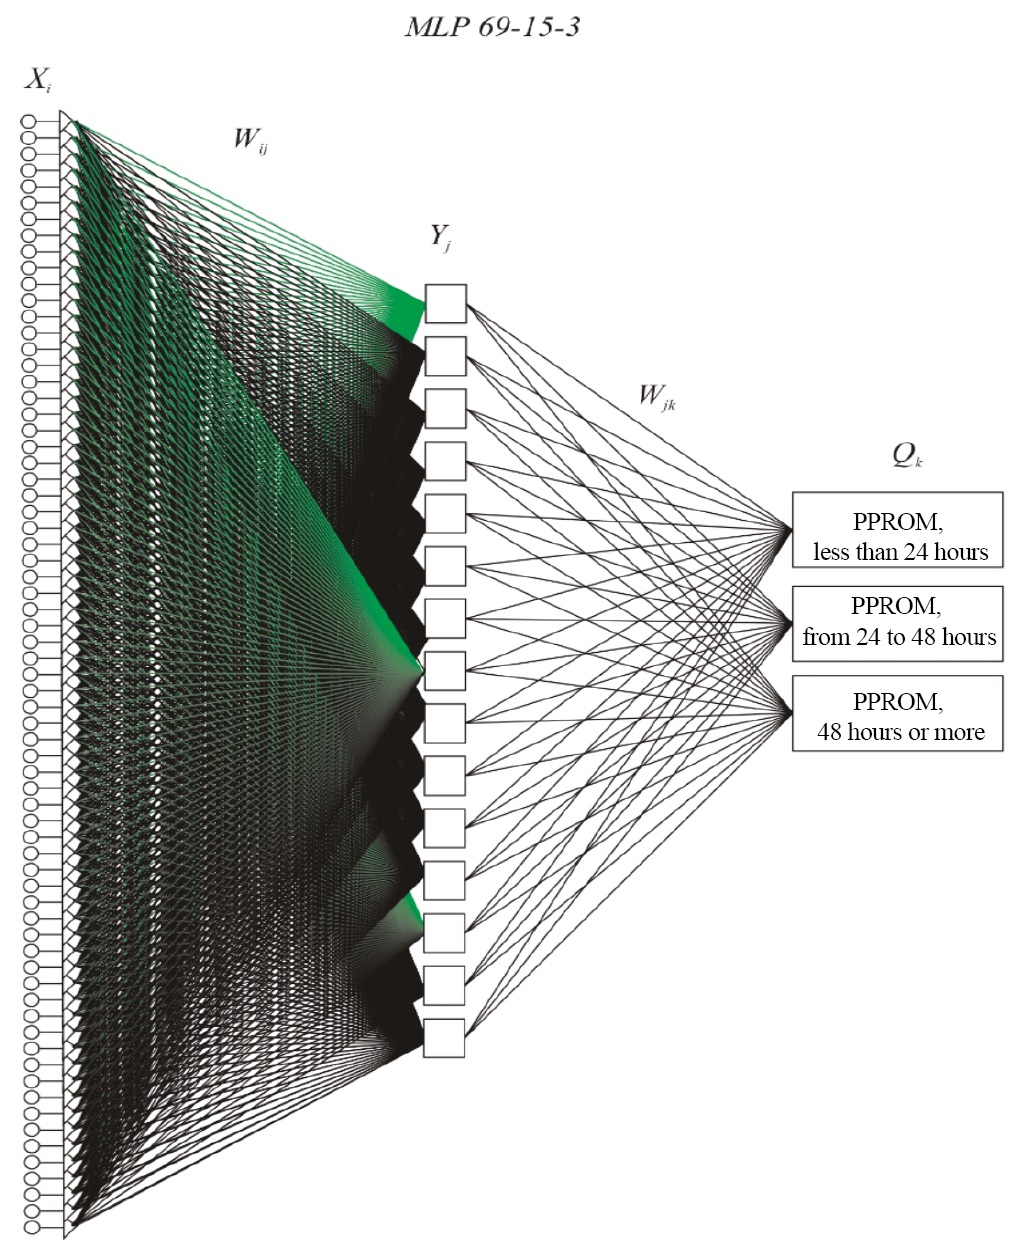
Fig. 4. Architecture of the MLP 69-15-3 neural network
Notes: The figure was created by the authors. Abbreviations: MLP (multilayer perceptron) — type of the neural network; 69 — number of input neurons determined by the sum of the number of quantitative predictors of the model and values taken by categorical predictors; 15 — number of inner neurons; 3 — number of output neurons determined by the number of predicted groups; Xi (i=1, …, 69), Yj (j=1, …, 15), Qk (k=1, …, 3) — designations of input, inner, and output neurons; Wij , Wjk — weights of neural connections between input and inner layers, as well as inner and output layers. PPROM — preterm prelabor rupture of membranes.
Рис. 4. Архитектура нейронной сети MLP 69-15-3
Примечания: рисунок выполнен авторами. Сокращения: MLP (multilayer perceptron, многослойный персептрон) — тип нейронной сети; 69 — количество нейронов входного слоя, определяется суммой числа количественных предикторов модели и значений, принимаемых категориальными предикторами; 15 — число нейронов внутреннего слоя; 3 — количество нейронов выходного слоя, определяется числом прогнозируемых групп; Xi (i=1, …, 69), Yj (j=1, …, 15), Qk (k=1, …, 3) — обозначение нейронов входного, внутреннего и выходного слоя; Wij, Wjk — веса нейронных связей входного и внутреннего слоя, внутреннего и выходного слоя. PPROM — преждевременный разрыв плодных оболочек.
The registration certificate RU 2024616463 (03/20/2024) was obtained for a computer program (V.A. Akinshina, S.S. Atagoy, G.A. Penzhoyan, L.Y. Karakhalis, and A.A. Khalafyan, Program for predicting the course of pregnancy and labor at different lengths of the latency period using neural networks), which has a simple and clear interface and is available for work on a personal computer.
The study results indicate that threatened miscarriage in the first trimester, presence of anemia, and respiratory diseases are associated with a longer latency period and early delivery, from 22 to 28 weeks (extremely preterm labor). The laboratory tests revealed a statistically significant postpartum decrease in the complete blood count levels: hemoglobin, hematocrit, white blood cell count, red blood cell count, and neutrophils, with a statistically significant CRP increase. A moderate correlation exists between the latency period length and endometrial echo on the third day after delivery as per ultrasound, which confirms the role of inflammation in the development of preterm labor.
Not identified.
A search for PPROM predictors affecting the latency period length showed that PPROM in pregnant women was not associated with their age and BMI. No differences were also found in the reproductive history (menstrual cycle; number of pregnancies and their outcomes) between groups with different lengths of the latency period. Of note is that significant differences between groups were noted in pregnancy duration: between pregnant women with a latency period of 12–24 hours (Group 1) and pregnant women with a latency period of over 48 hours (Group 3), p = 0.024. No statistically significant difference existed between Groups 1 and 2 (p = 1.0) and between Groups 2 and 3 (p = 0.781). We found no similar studies in the available literature.
The obtained data indicate that latency periods of over 48 hours in PPROM result in earlier deliveries, even extremely preterm (less than 28 weeks of gestation), as compared to the groups with a latency period of less than 48 hours. Thus, in Group 2, no delivery occurred before 28 weeks of gestation, whereas in Groups 1 and 3 the minimum duration of pregnancy with PPROM was 25 and 24 (extremely preterm labor) weeks of gestation, respectively.
Special attention should be paid to the fact that pregnant women with PPROM, depending on the length of the latency period, differ in the prevalence rate of respiratory diseases, which, according to the literature8,9 [8][9], increase the incidence of threatened miscarriage by over 30% and causes inflammatory changes in fetal membranes, contributing to the development of PPROM, oligohydramnios, and polyhydramnios, as reported by Efimkova et al. (2024) [10]. The role of anemia in pregnant women with PPROM is yet to be fully examined: the obtained data shows its prevalence rate is high in all of the groups, especially in Group 3 (with a latency period length of over 48 hours, anemia was detected in 43.59% of women), while in Groups 1 and 2, its incidence was 25.71 and 37.50%, respectively, which is consistent with previously obtained data9,10 [18–21]. An important factor is paternal smoking9,10 [13], which, together with maternal factors, to a certain extent affects the weight of newborns. The threatened miscarriage was commonly found in the pregnant women of Group 3 (56.41%), which seems to have determined the smallest pregnancy durations in this group, which are significantly different from those in Group 1 (p = 0.024).
The comparison of blood levels prior to and after delivery showed that the CRP level was higher after delivery as compared to the baseline in all the groups: Group 1. p < 0.001; Group 2, p = 0.025; Group 3, p = 0.001. The highest CRP level was found in Group 1, where only 20.0% of women received antibiotic therapy. Of note is the neutrophil count, which decreased in all the groups after delivery as compared to the baseline: Group 1, p < 0.001; Group 2, p = 0.017; Group 3, p < 0.001. A statistically significant reduction in the neutrophil count was caused by the lowered adaptive body defenses. This is also confirmed by the low weight of newborns (less than 2500 g) and the high incidence of congenital pneumonia, which was found in 47.56% of the examined children.
The registered program created on the basis of the obtained data provided a means to identify groups of patients requiring postpartum rehabilitation, as well as preparation for subsequent pregnancies, with a modified approach to the management of patients in the inter-birth interval.
Pregnant women with PPROM from Groups 1 and 3 exhibit differences in the pregnancy duration: extremely preterm and premature labor occurs when the latency period is over 48 hours. The effect of respiratory diseases on PPROM was analyzed. It is shown that the higher the prevalence rate and severity of anemia, the longer the latency period; paternal smoking, together with unfavorable maternal factors, affects fetal weight. The length of the latency period depends on whether the patient suffered from a threatened miscarriage in the first trimester. In Groups 2 and 3, pregnant women received the antibiotic treatment; since 80% of pregnant women in Group 1 did not receive this treatment, the CRP levels were more often elevated in this group in the postpartum period. A longer latency period was found to be associated with a higher incidence of pneumonia in newborns, which amounted to 48%. Thus, a detailed analysis of somatic and reproductive history, the course of current pregnancy, and neonatal health assessment constitute a cornerstone in the development of a program for groups of patients who have a history of PPROM and require obstetric rehabilitation in the inter-birth interval.
1. Nahamchen LG. Respiratory function in healthy pregnant patients and in pregnant patients with non-specific respiratory diseases. Bulletin of Physiology and Pathology of Respiration. 2001;8:64–69. (In Russ.)
Izbasarova BA, Koizhigitova DB, Kulmyrzaeva ZhP, Mominkhodzhaeva GKh, Tashmetova MA, Nurgalieva LI, Imanbaeva ZhA, Altaeva RA. Effect of chronic lung diseases on pregnancy. Vestnik KazNMU. 2015;1:263–266. (In Russ.)
2. Ibid.
3. Khodzhaeva ZS, Shmakov RG, Adamyan LV, Artymuk NV, Bashmakova NV, Bezhenar’ VF, Belokrinitskaya TE, Gladkova KA, Gorina KA, Dolgushina NV, Kostin IN, Krutova VA, Kulikov AV, Malyshkina AI, Martirosyan SV, Nikolaeva AV, Perevozkina OV, Radzinskii VE, Savel’eva GM, Serov VN, Priputnevich TV, Tetruashvili NK, Shabanova NE, Shaolina RI, Fatkullin IF, Filippov OS, Shifman EM, Tskhai VB Preterm labor, Moscow: 2024. (In Russ.)
4. Khalafyan AA Statistica. Mathematical statistics with elements of the probability theory. Moscow: Binom, 2010.
5. Nahamchen LG. Respiratory function in healthy pregnant patients and in pregnant patients with non-specific respiratory diseases. Bulletin of Physiology and Pathology of Respiration. 2001;8:64–69.
Izbasarova BA, Koizhigitova DB, Kulmyrzaeva ZhP, Mominkhodzhaeva GKh, Tashmetova MA, Nurgalieva LI, Imanbaeva ZhA, Altaeva RA. Effect of chronic lung diseases on pregnancy. Vestnik KazNMU. 2015;1:263–266.
6. Radzinsky VE, Semyatov SD, Totchiev GF, Shishkin EA. Smoking and pregnancy. RUDN Journal of Medicine. 2009;7:334–340.
Vasiljeva AA, Khakimova RF. Treatment of allergic rhinitis in women during pregnancy. Bulletin of Contemporary Clinical Medicine. 2015;2:82–88.
Luss LV. Allergy and Pregnancy. Lecture for Doctors. Doctor.ru. 2011;3:36–43.
7. Nahamchen LG. Respiratory function in healthy pregnant patients and in pregnant patients with non-specifi c respiratory diseases. Bulletin of Physiology and Pathology of Respiration. 2001;8:64–69.
Izbasarova BA, Koizhigitova DB, Kulmyrzaeva ZhP, Mominkhodzhaeva GKh, Tashmetova MA, Nurgalieva LI, Imanbaeva ZhA, Altaeva RA. Effect of chronic lung diseases on pregnancy. Vestnik KazNMU. 2015;1:263–266.
8. Nahamchen LG. Respiratory function in healthy pregnant patients and in pregnant patients with non-specific respiratory diseases. Bulletin of Physiology and Pathology of Respiration. 2001;8:64–69.
Izbasarova BA, Koizhigitova DB, Kulmyrzaeva ZhP, Mominkhodzhaeva GKh, Tashmetova MA, Nurgalieva LI, Imanbaeva ZhA, Altaeva RA. Effect of chronic lung diseases on pregnancy. Vestnik KazNMU. 2015;1:263–266.
Artymuk NV, Elizarova NN. Risk factors of premature rupture of membranes in women with preterm birth in the Kemerovo Region. Fundamental and Clinical Medicine. 2016;1(2):6–11.
9. Radzinsky VE, Semyatov SD, Totchiev GF, Shishkin EA. Smoking and pregnancy. RUDN Journal of Medicine. 2009;7:334–340.
10. Vasiljeva AA, Khakimova RF. Treatment of allergic rhinitis in women during pregnancy. Bulletin of Contemporary Clinical Medicine. 2015;2:82–88.
Luss LV. Allergy and Pregnancy. Lecture for Doctors. Doctor .ru. 2011;3:36–43.
1. Jena BH, Biks GA, Gete YK, Gelaye KA. Incidence of preterm premature rupture of membranes and its association with inter-pregnancy interval: a prospective cohort study. Sci Rep. 2022;12(1):5714. https://doi.org/10.1038/s41598-022-09743-3
2. Kim MS, Kim S, Seo Y, Oh MY, Yum SK. Impact of preterm premature rupture of membranes and oligohydramnios on in-hospital outcomes of very-low-birthweight infants. J Matern Fetal Neonatal Med. 2023;36(1):2195523. https://doi.org/10.1080/14767058.2023.2195523
3. Boettcher LB, Clark EAS. Neonatal and Childhood Outcomes Following Preterm Premature Rupture of Membranes. Obstet Gynecol Clin North Am. 2020;47(4):671–680. https://doi.org/10.1016/j.ogc.2020.09.001
4. Herzlich J, Mangel L, Halperin A, Lubin D, Marom R. Neonatal outcomes in women with preterm premature rupture of membranes at periviable gestational age. Sci Rep. 2022;12(1):11999. https://doi.org/10.1038/s41598-022-16265-5
5. Schmitz T, Sentilhes L, Lorthe E, Gallot D, Madar H, Doret-Dion M, Beucher G, Charlier C, Cazanave C, Delorme P, Garabédian C, Azria E, Tessier V, Sénat MV, Kayem G. Preterm premature rupture of the membranes: Guidelines for clinical practice from the French College of Gynaecologists and Obstetricians (CNGOF). Eur J Obstet Gynecol Reprod Biol. 2019;236:1–6. https://doi.org/10.1016/j.ejogrb.2019.02.021
6. Sklar A, Sheeder J, Davis AR, Wilson C, Teal SB. Maternal morbidity after preterm premature rupture of membranes at <24 weeks’ gestation. Am J Obstet Gynecol. 2022;226(4):558.e1–558.e11. https://doi.org/10.1016/j.ajog.2021.10.036
7. Feduniw S, Gaca Z, Malinowska O, Brunets W, Zgliczyńska M, Włodarczyk M, Wójcikiewicz A, Ciebiera M. The Management of Pregnancy Complicated with the Previable Preterm and Preterm Premature Rupture of the Membranes: What about a Limit of Neonatal Viability?-A Review. Diagnostics (Basel). 2022;12(8):2025. https://doi.org/10.3390/diagnostics12082025
8. Castro PT, Matos AP, Heron W, Looes FPP, Tonni G, Araujo Junior E. Covid-19 and pregnancy: An Overview. Rev Bras Ginecol obstet. 2020;42:07:420–426. https://doi.org/10.1055/s-0040-1713408
9. Rasmussen SA, Smulian JG, Lednicky JA, Wen TS, Jamieson DJ. Coronavirus Disease 2019 (COVID-19) and pregnancy: what obstetricians need to know. Am J Obstet Gynecol. 2020;222:5:415–426. https://doi.org/10.1016/j.aiog.2020.02.17
10. Efimkova EB, Novikova SV, Dulaeva EV, Ignat’eva MA, Biryukova NV, Fedotova AV, Budykina TS, Bocharova II, Klimova IV, Pel’she EV.Acute respiratory infections in pregnant women with respiratory diseases. Obstetric and perinatal outcomes. Russian Bulletin of Obstetrician-Gynecologist. 2024;24(1):76–82 (In Russ.). https://doi.org/10.17116/rosakush20242401176
11. ACOG committee opinion no. 557: Management of acute abnormal uterine bleeding in nonpregnant reproductive-aged women. Obstet Gynecol. 2013;121(4):891–896. https://doi.org/10.1097/01. AOG.0000428646.67925.9a
12. Chursina OA, Konstantinova OD, Sennikova ZhV, Demina LM, Loginova EA Effects of active and passive smoking on pregnancy and children. Russian Bullletin of Obstetrician-Gynecologist. 2019;19(4):47–52 (In Russ.). https://doi.org/10.17116/rosakush20191904147
13. Kiseleva LG, Vasilieva SN, Kozhevnikov ED, Solovyova AS, Bessolova NA. Cimpsumption of nicotine-containing products by women during pregnancy. Russian Journal of Preventive Medicine. 2023;26(1):80–84 (In Russ.). https://doi.org/10.17116/profmed20232601180
14. Peredkova YeV, Sebekina OV. The Effect of Pregnancy on the Course of Allergic Diseases. Effective Pharmacotherapy. 2019;15(37):18–26 (In Russ.). http://dx.doi.org/10.33978/2307-3586-2019-15-37-18-26
15. Klemenov AV. Treatment Strategy in Allergie Diseases in Pregnancy. Lechebnoe Delo. 2021;1:25–30 (In Russ.). https://doi.org/10.24412/2071-5315-2021-12287
16. Committee on Practice Bulletins-Obstetrics. ACOG Practice Bulletin No. 188: Prelabor Rupture of Membranes. Obstet Gynecol. 2018;131(1):e1–e14. https://doi.org/10.1097/AOG.0000000000002455. PMID: 29266075
17. Karakhalis LYu, Andreeva MD, Akhidzhak AN. Influence of inflammation on iron levels in pregnant women. Farmakologiya&Farmakoterapiya. 2023;1:26–33 (In Russ.). https://doi.org/10.46393/27132129_2023_1_26
18. Belotserkovtseva LD, Kovalenko LV, Zinin VN, Ivannikov SE, Keldasova MR. Iron deficiency anemia in pregnant women. Ural Medical Journal. 2023;22(5):140–149 (In Russ.). https://doi.org/10.52420/2071-5943-2023-22-5-140-149
19. Tskhai VB, Naberezhnev YuI, Dudina AYu, Golovchenko OV. Transabdominal amnioinfusion for prolongation of pregnancy in premature rupture of membranes and hypamnion: Possibilities and prospects. Akusherstvo i Ginekologiia. 2016;11:5–10 (In Russ.). http://dx.doi.org/10.18565/aig.2016.11.5-10
20. Dolgushin II, Mezentseva EA, Savochkina AY, Kuznetsova EK. Neutrophil as a multifunctional relay in immune system. Russian Journal of Infection and Immunity. 2019;9(1):9–38 (In Russ.). http://dx.doi.org/10.15789/2220-7619-2019-1-9-38
21. Shevela EYa, Bukhtueva NG, Tikhonova MA, Sakhno LV, Pasman NM, Chernykh ER. Expression of arginase 1 and tyrosine kinase Mer by blood monocytes in the dynamics of physiological pregnancy. Medical Immunology. 2023;25(3):507–512 (In Russ.). https://doi.org/10.15789/1563-0625-EOA-2728
Semen S. Atagoy - graduate student, Department of Obstetrics, Gynecology, and Perinatology No. 2; obstetrician-gynecologist, Perinatal Сenter
Mitrofana Sedina str., 4, Krasnodar, 350063
Pobedy Square, 1, Krasnodar, 350053
Grigoriy A. Penzhoyan - Dr. Sci. (Med.), Prof., Departmental Head, Department of Obstetrics, Gynecology, and Perinatology No. 2
Mitrofana Sedina str., 4, Krasnodar, 350063
Liudmila Yu. Karakhalis - Dr. Sci. (Med.), Prof., Department of Obstetrics, Gynecology, and Perinatology No. 2
Mitrofana Sedina str., 4, Krasnodar, 350063,
Atagoy S.S., Penzhoyan G.A., Karakhalis L.Yu. Cause and effect of preterm prelabor rupture of membranes during pregnancy: An observational cohort study. Kuban Scientific Medical Bulletin. 2025;32(2):15-28. https://doi.org/10.25207/1608-6228-2025-32-2-15-28
Sedin str. 4, Krasnodar, Russian Federation, 350063
Tel.: (861) 268 55 02
E-mail: kubmedvestnik@ksma.ru, kubmedvestnik@mail.ru


