


Contents
Scroll to:
https://doi.org/10.25207/1608-6228-2025-32-5-18-31
Scroll to:
Background. Chronic apical periodontitis is an inflammatory disease associated with infection of the root canal and represents a major challenge in dentistry. Its prevalence is rapidly increasing among the adult population. The condition is characterized by variability in inflammatory responses and bone resorption. Genetic factors play a central role in its pathogenesis. Single-nucleotide polymorphisms (SNPs) significantly affect gene expression and protein activity. Recent studies highlight the importance of integrating genetic data into clinical dentistry.
Objective. To determine the role of intergenic associations of key genes involved in the modulation of inflammatory and immune responses in hereditary predisposition to chronic apical periodontitis.
Methods. A prospective single-center case control study was conducted from November 2024 to April 2025 at the Yaroslavl State Medical University (Ministry of Health of the Russian Federation) and the Medical Center for Diagnostics and Prevention “Sodruzhestvo.” The study involved 200 participants: 150 patients with chronic apical periodontitis and 50 healthy controls. The diagnosis was confirmed clinically and radiographically. Single-nucleotide polymorphisms of eight genes (IL-10, IL-1β, TNF-α, GSTP1, CYP1A2, TP53, COL1A1, and MMP-9) were analyzed using real-time polymerase chain reaction (PCR). Statistical analysis was performed using JMP Pro v.18.0 (SAS Institute Inc., https://www.jmp.com, 2024), Haplostats v.1.9.7 (Schaid, D.J., & Sinnwell, J.P., Software for haplotype-based association analysis, USA), and MDR v.3.0.2 (Multifactor Dimensionality Reduction, SourceForge, USA). The optimal models were identified based on the highest cross-validation consistency (CVC) and lowest testing balanced accuracy error. The significance level was set at p < 0.05. Results. MDR analysis revealed significant intergenic interactions associated with the development of chronic apical periodontitis. The three-locus model IL-1β×TNF-α×MMP-9 demonstrated the highest predictive value (balanced accuracy 79.8%, cross-validation consistency 10/10), highlighting the synergistic effect of inflammatory cytokines and proteolytic processes. Hardy–Weinberg equilibrium analysis showed deviations for CYP1A2 and TP53 in the chronic apical periodontitis group, suggesting an influence of environmental factors. The Fruchterman—Reingold graph confirmed a strong interaction between IL-1β and TNF-α, whereas COL1A1 displayed a moderate association. These findings indicate the multigenic nature of predisposition to chronic apical periodontitis and enable personalized diagnostics and therapy based on the combined genetic effects.
Conclusion. The results of this study may lay a foundation for developing personalized diagnostic and treatment strategies that account for individual genetic profiles. Integrating such approaches into clinical practice could improve disease outcome prediction, optimize therapeutic interventions, and reduce the risk of complications related to the pathological process.
Bagryantseva N.V. Multilocus models of polymorphic genes and their role in assessing the risk of chronic apical periodontitis: A prospective single-center case control study. Kuban Scientific Medical Bulletin. 2025;32(5):18-31. https://doi.org/10.25207/1608-6228-2025-32-5-18-31
Chronic apical periodontitis (CAP) is an inflammatory disease of the periapical tissues associated with root canal infection and represents a serious challenge in dental practice. Its prevalence reaches up to 52% among the adult population, with clinically detectable manifestations in about 5% of patients [1][2]. The disease develops as a result of a complex interaction between root canal microbial infection and genetic predisposition, which determines the variability of inflammatory reactions, immune response, and bone tissue resorption. CAP not only reduces the quality of life but also requires comprehensive therapeutic approaches applied to individual pathogenic mechanisms [3–5].
Genetic factors play a central role in the modulation of pathological processes in CAP. Particular attention has been paid to candidate genes such as pro-inflammatory cytokines (IL-1β [interleukin], TNF-α [tumor necrosis factor]), anti-inflammatory mediators (IL-10), matrix metalloproteinases (MMPs), and regulators of bone metabolism [3][6]. For example, polymorphisms in the IL-1β and TNF-α genes are associated with increased production of pro-inflammatory markers, which exacerbates tissue destruction [1][4]. Conversely, variations in the IL-10 gene may limit excessive immune responses, slowing disease progression [7]. Experimental data from animal models support these findings: blockade of the IL-17RA receptor leads to marked bone loss, emphasizing the role of cytokines in regulating osteoclastogenesis [2][8].
Single-nucleotide polymorphisms (SNPs), the most common form of genetic variation, significantly influence gene expression and protein functional activity [2][5][7]. For instance, SNPs in the CYP2D6 gene, involved in xenobiotic metabolism, may reduce the efficacy of pharmacotherapy by altering drug pharmacokinetics [9]. Polymorphisms in TP53, a regulator of apoptosis and DNA repair, are associated with impaired elimination of damaged cells, contributing to the chronification of inflammation [10]. Variations in COL1A1, the gene encoding type I collagen, affect the structural integrity of the periodontal ligament and bone regeneration [11]. Interestingly, SNPs in MMP-9 demonstrate a paradoxical effect: reduced proteolytic activity of the enzyme may lead to the accumulation of damaged proteins, thereby amplifying inflammatory responses despite theoretically slowing bone resorption [12].
Recent studies emphasize the need to integrate genetic data into clinical practice. The analysis of Hardy–Weinberg equilibrium (HWE) for SNPs has revealed significant deviations in control groups. That may reflect the influence of environmental factors (such as toxin exposure) on genotype distribution [4][13]. For example, deviations from HWE in CYP1A2 among control populations indicate an association between its polymorphisms and xenobiotic metabolism, which must be considered in data interpretation [14].
The aim of this study was to determine the role of intergenic associations among key genes involved in the modulation of inflammatory and immune responses in hereditary predisposition to chronic apical periodontitis.
A prospective single-center case control study was conducted. The study included two groups of participants: a group of patients with chronic apical periodontitis (CAP) (n = 150) and a control group (n = 50) of healthy individuals without any signs of inflammatory disease. Treatment for CAP involved extraction of the affected tooth.
The research was carried out at the Department of Clinical Dentistry and Maxillofacial Surgery No. 1 of Yaroslavl State Medical University (Ministry of Health of the Russian Federation) and at the Dental Department of the Medical Center for Diagnostics and Prevention “Sodruzhestvo,” from November 2024 to April 2025.
Inclusion criteria
For all study groups: male and female patients aged 18 to 65 years; voluntary informed consent to participate in the study. For the case group: verified diagnosis of chronic apical periodontitis; indication for extraction of the affected tooth. For the control group: absence of teeth affected by pulpitis or chronic apical periodontitis.
Exclusion criteria
For all study groups: acute apical periodontitis; presence of stomatitis or other infectious inflammatory diseases of the oral cavity; smoking; diabetes mellitus and/or chronic inflammatory diseases; pregnancy or lactation period; use of antibiotics, corticosteroids, or NSAIDs within one month prior to study initiation; history of chemotherapy or previous radiation therapy of the head and neck region; previous apicoectomy or root fracture of the affected tooth; complications during healing.
Withdrawal criteria
For all study groups: withdrawal of consent to participate; personality or behavioral disorders that could interfere with understanding or following treatment recommendations; changes in health status or any surgical intervention during the study period.
Diagnostic criteria of eligibility
Patient selection was based on a verified diagnosis of chronic apical periodontitis, confirmed both clinically and radiographically. The disease was characterized by bone destruction in the apical area of one or more roots of the affected tooth. Tooth extraction was indicated since conservative treatment was not possible. The control group consisted of individuals without clinical or radiographic signs of periodontal inflammation, who underwent regular dental checkups and had whose oral cavity was free of pathogens after thorough disinfection.
Participant selection and allocation to groups
A total of 200 participants were included in the study and divided into two groups. The case group consisted of 150 patients with clinically and radiographically confirmed chronic apical periodontitis. The control group comprised 50 healthy volunteers meeting inclusion criteria. Detailed inclusion and exclusion parameters for participant selection are presented above.
Primary endpoints
To determine the role of intergenic associations among key genes involved in the modulation of inflammatory and immune responses in hereditary predisposition to chronic apical periodontitis. To identify the most optimal multilocus models of gene polymorphisms with the highest cross-validation consistency (CVC) and the lowest testing balanced accuracy error.
Secondary endpoints
To assess differences in the distribution of genotypes for the polymorphic variants of the studied genes.
Methods used to evaluate study endpoints
Venous blood samples (6 mL each) were collected from the cubital vein of all participants into vacuum tubes (Lab-Vac, Shandong Chengwu Medical Products Factory, China). The samples were transported and stored within 12 hours after collection. Analysis of single-nucleotide polymorphisms (SNPs) was carried out using real-time polymerase chain reaction (PCR) with fluorescent detection. Genomic DNA was extracted from leukocytes in whole blood and analyzed using reagent kits DNA-Express-Blood (Litekh LLC, Russia) and DNA-Extran 1 (Syntol CJSC, Russia). Amplification was performed using the DTprime 5M3 real-time detecting amplifier (DNA-Technology LLC, Russia) without electrophoresis. Two allele-specific amplification reactions were conducted for each polymorphism, using two pairs of primers. Fluorescent detection of the amplified DNA fragment was performed using the intercalating asymmetric cyanine dye SYBR Green I (Molecular Probes Inc., USA). Fluorescent signal accumulation in the FAM channel (6-carboxyfluorescein) was analyzed with DT-Master software (DNA-Technology LLC, Russia). Homozygous genotypes produced a signal in one fluorescence channel, whereas heterozygous genotypes produced signals in both. Based on the results, three genotypes were identified: homozygote for allele 1, heterozygote and homozygote for allele 2. The following single-nucleotide polymorphisms were studied:
Predictors: unaccounted genetic polymorphisms.
Confounders: age, sex, smoking status, comorbidities.
Effect modifiers: use of medications, surgical interventions, oral infections.
Potentially confounding variables were excluded a priori through study design and participant selection, ensuring their absence in both analyzed groups.
Sample Size Calculation
Sample size was estimated to provide 80% power of the study at α < 0.05. The minimum required sample size was calculated as 45 observations per group, accounting for possible dropout or late exclusion.
Statistical Methods
Statistical analysis was performed using JMP Pro Statistical Discovery v.18.0 (SAS Institute Inc., USA, 2024). Genotyping results were tested for Hardy–Weinberg equilibrium. Categorical data were presented as absolute and relative frequencies. Depending on group sizes, the Pearson chi-square test or Fisher’s exact test was applied to compare proportions. Differences in genotype distributions between study groups were assessed using odds ratios (ORs) and 95% confidence intervals (CIs). The Shapiro–Wilk test was used to assess data normality. Depending on this assessment, distributed data were presented as mean (M), standard deviation (SD), median (Me) and interquartile range [LQ, HQ]. The same principle was applied in selecting criteria for group comparisons; the choice was made between the Student’s t-test or the Mann–Whitney U test. Software for haplotype-based association analysis (Haplostats v.1.9.7, Schaid & Sinnwell, USA) and multifactor dimensionality reduction (MDR v.3.0.2, SourceForge, USA) was employed. MDR enables evaluation of gene–gene and gene–environment interactions associated with qualitative phenotypes, correction for covariates, and model validation using permutation testing. It also allows model cross-validation and graphical visualization of interaction type (synergy, additive interactions, redundancy) and strength (entropy contribution). A significance level in testing statistical hypotheses was assumed < 0.05.
To enhance the generalizability of findings, patients seeking dental care were enrolled based on random selection using a computer-generated randomization. Thus, out of every 10 patients screened, 5 were randomly chosen for inclusion. A total of 200 participants were divided into two groups: the case group with chronic apical periodontitis (n = 150) and the control group (n = 50) (Fig. 1).
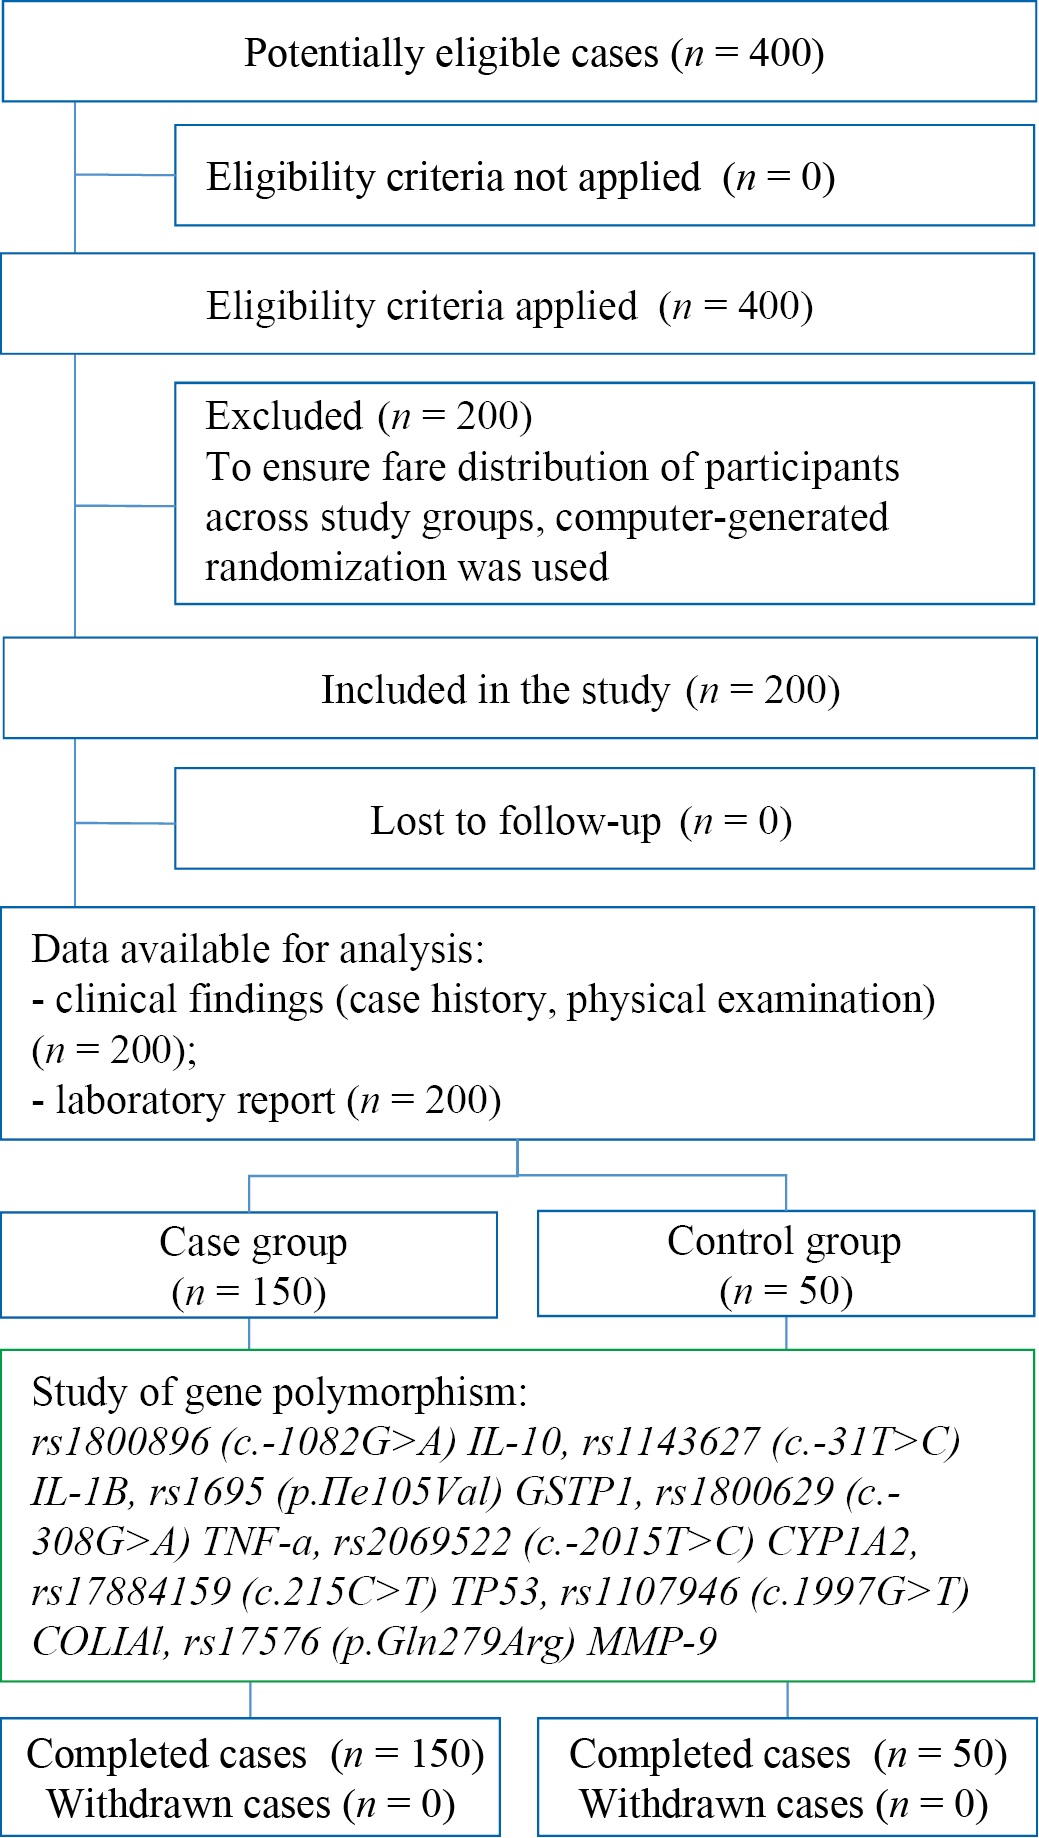
Fig. 1. Study design
Note: The flow diagram was made by the author (with accordance with STROBE guidelines). Abbreviations: rs — reference single nucleotide polymorphism; c. — position relative to start codon; p. — protein polymorphism; IL-10 — interleukin-10; IL-1β — interleukin-1β; GSTP-1 — glutathione-S-transferase P1; TNF-α — tumor necrosis factor α; CYP1A2 — cytochrome P450 1A2; TP53 — tumor suppressor P53; COL1A1 — type 1A1 collagen; MMP9 — matrix metal peptidase 9.
Рис. 1. Блок-схема дизайна исследования
Примечание: блок-схема выполнена автором (согласно рекомендациям STROBE). Сокращения: rs — эталонный однонуклеотидный полиморфизм; c. — позиция относительно стартового кодона гена; p. — изменение на уровне белка; IL-10 — интерлейкин-10; IL-1β — интерлейкин-1 бета; GSTP1 — глутатион-S-трансфераза П1; TNF-α — фактор некроза опухоли-альфа; CYP1А2 — цитохром П450 1А2; TP53 — опухолевый супрессор П53; COL1A1 — коллаген тип 1 A1; MMP-9 — матриксная металлопептидаза 9.
The control group was composed of volunteers who met the inclusion criteria and exhibited no signs of inflammatory oral diseases. This methodology ensured strict standardization of the sample and minimized potential sources of data bias. Data confidentiality was maintained through anonymization of biological samples and encryption of electronic records. The informed consent of participants included the right to withdraw from the study at any time without explanation.
No statistically significant differences were found between the two groups in terms of age, as determined by the t-test (p > 0.05). The mean age in the case group was 33.6 ± 9.2 years, and in the control group, 31.5 ± 8.4 years. No significant differences were observed in the sex distribution between groups. The case group included 75 men and 75 women, while the control group consisted of 25 men and 25 women, maintaining the same ratio.
In this study, aimed at deepening the understanding of the complex molecular genetic mechanisms underlying the development of chronic apical periodontitis (CAP), the objective was to determine the role of specific intergenic associations among key genes involved in the modulation of inflammatory and immune responses. Chronic apical periodontitis is a persistent inflammatory disease of the tissues surrounding the tooth root apex, characterized by bone tissue destruction and the formation of periapical lesions. The pathogenesis of this condition is multifactorial, with a significant interaction between genetic predisposition and environmental factors. To address the study objectives, a comprehensive analysis was performed of the distribution of genotype and allele frequencies in well-defined groups: a group of patients with a verified diagnosis of CAP and a demographically matched control group. The analysis covered eight preselected polymorphic markers (single-nucleotide polymorphisms, SNPs) located in genes encoding proteins directly involved in immune regulation, inflammatory cascades, xenobiotic metabolism, and cell-cycle control. Detailed results of the primary genotype distribution for all studied loci in the compared groups are presented in Table 1.
Table 1. Distribution of genotypes across polymorphic markers in study groups
Таблица 1. Распределение генотипов по полиморфным маркерам в исследуемых группах
|
Polymorphism |
Genotype |
All cases |
Group |
||||
|
Control |
Case |
||||||
|
n |
% |
n |
% |
n |
% |
||
|
rs1800896 |
A/A |
17 |
8 |
2 |
4 |
15 |
10 |
|
G/A |
68 |
34 |
9 |
18 |
59 |
39 |
|
|
G/G |
115 |
57 |
39 |
78 |
76 |
51 |
|
|
rs1143627 |
C/C |
23 |
12 |
4 |
8 |
19 |
13 |
|
T/C |
82 |
41 |
12 |
24 |
70 |
47 |
|
|
T/T |
95 |
48 |
34 |
68 |
61 |
41 |
|
|
rs1800629 |
A/A |
75 |
38 |
30 |
60 |
45 |
30 |
|
A/G |
95 |
48 |
14 |
28 |
81 |
54 |
|
|
G/G |
30 |
15 |
6 |
12 |
24 |
16 |
|
|
rs1695 |
A/A |
80 |
40 |
12 |
24 |
68 |
45 |
|
A/G |
75 |
38 |
21 |
42 |
54 |
36 |
|
|
G/G |
45 |
22 |
17 |
34 |
28 |
19 |
|
|
rs2069522 |
C/C |
12 |
6 |
0 |
0 |
12 |
8 |
|
T/C |
10 |
5 |
2 |
4 |
8 |
5 |
|
|
T/T |
178 |
89 |
48 |
96 |
130 |
87 |
|
|
rs17884159 |
C/C |
174 |
87 |
47 |
94 |
127 |
85 |
|
C/T |
20 |
10 |
3 |
6 |
17 |
11 |
|
|
T/T |
6 |
3 |
0 |
0 |
6 |
4 |
|
|
rs1107946 |
A/A |
10 |
5 |
3 |
6 |
7 |
5 |
|
C/A |
45 |
22 |
10 |
20 |
35 |
23 |
|
|
C/C |
145 |
72 |
37 |
74 |
108 |
72 |
|
|
rs17576 |
A/A |
80 |
40 |
23 |
46 |
57 |
38 |
|
A/G |
82 |
41 |
21 |
42 |
61 |
41 |
|
|
G/G |
38 |
19 |
6 |
12 |
32 |
21 |
|
Note: The table is compiled by the author. Abbreviations: rs — reference single nucleotide polymorphism; c. — position relative to start codon; p. — protein polymorphism; IL-10 — interleukin-10; IL-1β — interleukin-1β; GSTP-1 — glutathione-S-transferase P1; TNF-α — tumor necrosis factor α; CYP1A2 — cytochrome P450 1A2; TP53 — tumor suppressor P53; COL1A1 — type 1A1 collagen; MMP9 — matrix metal peptidase 9.
Примечание: таблица составлена автором. Сокращения: rs — эталонный однонуклеотидный полиморфизм; c. — позиция относительно стартового кодона гена; p. — изменение на уровне белка; IL-10 — интерлейкин-10; IL-1β — интерлейкин-1 бета; GSTP1 — глутатион-S-трансфераза П1; TNF-α — фактор некроза опухоли-альфа; CYP1А2 — цитохром П450 1А2; TP53 — опухолевый супрессор П53; COL1A1 — коллаген тип 1 A1; MMP-9 — матриксная металлопептидаза 9.
The first step was a traditional single-locus analysis. It aimed at assessing potential associations between individual single-nucleotide polymorphisms and the individual risk of developing chronic apical periodontitis. This method reveals statistically significant differences in the frequency of specific genotypes or alleles between patients and controls, which may indicate either a predisposing effect of a genetic variant or its potential protective function. Among the eight analyzed polymorphic markers, statistically significant differences in genotype distribution were reliably established for several key genes, which highlights their potential involvement in the pathogenesis of CAP.
Specifically, analysis of the rs1800896 (c.-1082G>A) polymorphism located in the promoter region of the interleukin-10 (IL-10) gene, which encodes a major anti-inflammatory cytokine, demonstrated that the homozygous A/A genotype occurred significantly more frequently among patients with chronic apical periodontitis (10%) than in the control group (4%). The statistical significance of this difference was confirmed by Pearson chi-square test (χ² = 3.92, p = 0.048). This finding suggests that the A/A genotype of rs1800896 in the IL-10 gene may be associated with increased susceptibility to CAP. Conversely, the G/G homozygous genotype for the same polymorphic marker was found significantly more often in healthy individuals (78%) than in patients (51%; χ² = 5.14, p = 0.023), indicating a possible protective role of the G/G genotype, that is, its carriers may have a reduced risk of developing chronic inflammation of periapical tissues.
Similarly, significant associations were identified for the rs1143627 (c.-31T>C) polymorphism of the interleukin-1 beta (IL-1β) gene, which encodes a potent pro-inflammatory cytokine responsible for initiating and maintaining inflammatory responses, including those in periodontal tissues. The T/T homozygous variant of this SNP was significantly more frequent among healthy controls (68% vs. 41% in the CAP group; χ² = 6.87, p = 0.009), suggesting a potentially protective function. In contrast, the T/C heterozygous genotype of rs1143627 was significantly more common in patients with confirmed chronic apical periodontitis (47% vs. 24% in controls; χ² = 5.93, p = 0.015), indicating a possible association with increased disease risk. These data are consistent with extensive literature emphasizing the pro-inflammatory activity of IL-1β as a factor promoting bone destruction, and the anti-inflammatory, immunosuppressive effect of IL-10. The convergence of these independent findings strongly supports the fundamental importance of cytokine imbalance in the complex pathogenesis of chronic inflammatory periodontal diseases, including apical periodontitis [4][15].
To obtain a more comprehensive picture of the relationships among the analyzed genetic factors and their potential interactions with environmental factors (collectively denoted as Disease), a modern network visualization technique was employed to map gene–environment and gene–gene interactions. The visualization was implemented using the Kamada–Kawai force-directed algorithm, which efficiently arranges nodes (genes, factors) on a plane so that the distances between them optimally reflect attraction or repulsion forces corresponding to the interaction strength. The resulting graphical model, presented in Fig. 2, largely confirms and ullustrates the patterns identified in the preceding single-locus analysis, showing the relative proximity or separation of key genetic markers from each other and from the Disease node.
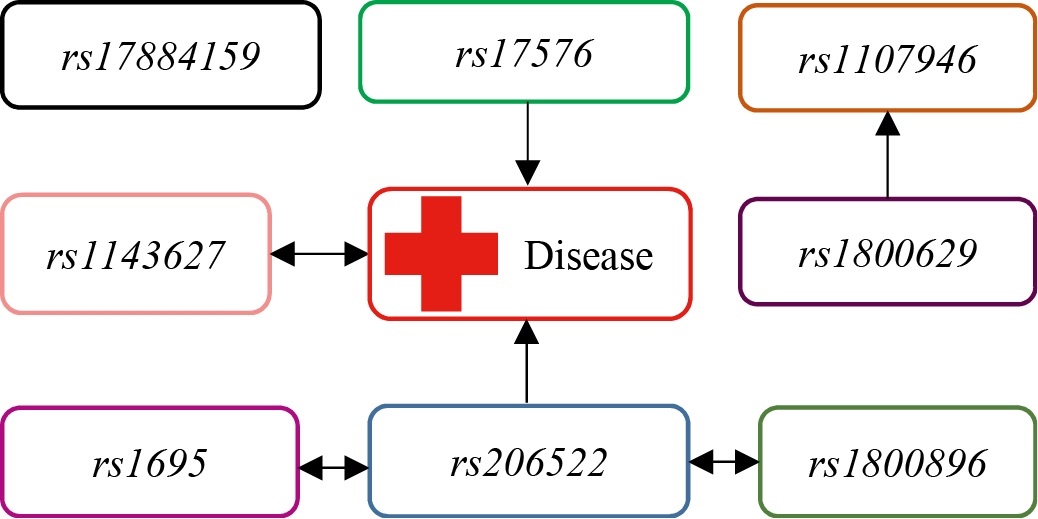
Fig. 2. Single-layer gene-environment and gene-gene interaction using Kamada-Kawai algorithm
Note: the figure is made by the author. Abbreviation: rs — reference single nucleotide polymorphism.
Рис. 2. Одноранговое ген-средовое и ген-генное взаимодействие по алгоритму Камада — Каваи
Примечание: рисунок выполнен автором. Сокращение: rs — эталонный однонуклеотидный полиморфизм.
However, it is important to emphasize that pairwise interactions, which are the primary focus of single-locus analysis, are often insufficient to exhaustively show how complex existing relationships within the studied biological phenomena are. This is particularly true for multifactorial diseases such as chronic apical periodontitis (CAP), where complex epistatic effects and nonlinear interactions between multiple genes and environmental triggers are likely to occur.
An essential step in any genetic association study is to verify whether the observed genotype frequencies in the studied populations conform to the expected frequencies predicted by the Hardy–Weinberg equilibrium (HWE). This fundamental principle of population genetics states that, in the absence of external influences (such as mutation, migration, selection, genetic drift, or non-random mating), genotype frequencies at an autosomal locus remain constant from generation to generation. Deviations from HWE in the control group may indicate potential issues with genotyping quality or lack of sample representativeness, whereas deviations observed only in the patient group may suggest a possible effect of the disease itself on the population structure. The results of this analysis for all eight investigated single-nucleotide polymorphisms (SNPs) are presented in Table 2.
Table 2. Sensitive test results for Hardy-Weinberg equilibrium
Таблица 2. Результаты точного теста на равновесие Харди — Вайнберга
|
Polymorphism |
Group |
Heterozygotes |
Homozygotes |
Total |
p-value |
||
|
Allele 1 |
Allele 2 |
Allele 1 |
Allele 2 |
||||
|
rs1800896 |
All |
115 |
17 |
68 |
298 |
102 |
0.1400 |
|
Control |
39 |
2 |
9 |
87 |
13 |
0.1700 |
|
|
Case |
76 |
15 |
59 |
211 |
89 |
0.5600 |
|
|
rs1143627 |
All |
95 |
23 |
82 |
272 |
128 |
0.4200 |
|
Control |
34 |
4 |
12 |
80 |
20 |
0.0830 |
|
|
Case |
61 |
19 |
70 |
192 |
108 |
1.0000 |
|
|
rs1800629 |
All |
75 |
30 |
95 |
245 |
155 |
1.0000 |
|
Control |
30 |
6 |
14 |
74 |
26 |
0.0650 |
|
|
Case |
45 |
24 |
81 |
171 |
129 |
0.2500 |
|
|
rs1695 |
All |
80 |
45 |
75 |
235 |
165 |
0.0014 |
|
Control |
12 |
17 |
21 |
45 |
55 |
0.2700 |
|
|
Case |
68 |
28 |
54 |
190 |
110 |
0.0079 |
|
|
rs2069522 |
All |
178 |
10 |
12 |
366 |
34 |
0.0001 |
|
Control |
48 |
2 |
0 |
98 |
2 |
1.0000 |
|
|
Case |
130 |
8 |
12 |
268 |
32 |
0.0001 |
|
|
rs17884159 |
All |
174 |
20 |
6 |
368 |
32 |
0.0004 |
|
Control |
47 |
3 |
0 |
97 |
3 |
1.0000 |
|
|
Case |
127 |
17 |
6 |
271 |
29 |
0.0006 |
|
|
rs1107946 |
All |
145 |
45 |
10 |
335 |
65 |
0.0190 |
|
Control |
37 |
10 |
3 |
84 |
16 |
0.0890 |
|
|
Case |
108 |
35 |
7 |
251 |
49 |
0.0760 |
|
|
rs17576 |
All |
80 |
82 |
38 |
242 |
158 |
0.0540 |
|
Control |
23 |
21 |
6 |
67 |
33 |
0.7500 |
|
|
Case |
57 |
61 |
32 |
175 |
125 |
0.0450 |
|
Note: The table is compiled by the author. Abbreviations: rs — reference single nucleotide polymorphism; c. — position relative to start codon; p. — protein polymorphism; IL-10 — interleukin-10; IL-1β — interleukin-1β; GSTP-1 — glutathione-S-transferase P1; TNF-α — tumor necrosis factor α; CYP1A2 — cytochrome P450 1A2; TP53 — tumor suppressor P53; COL1A1 — type 1A1 collagen; MMP9 — matrix metal peptidase 9.
Примечание: таблица составлена автором. Сокращения: rs — эталонный однонуклеотидный полиморфизм; c. — позиция относительно стартового кодона гена; p. — изменение на уровне белка; IL-10 — интерлейкин-10; IL-1β — интерлейкин-1 бета; GSTP1 — глутатион-S-трансфераза П1; TNF-α — фактор некроза опухоли-альфа; CYP1А2 — цитохром П450 1А2; TP53 — опухолевый супрессор П53; COL1A1 — коллаген тип 1 A1; MMP-9 — матриксная металлопептидаза 9.
The analysis showed that in the control group of healthy individuals, all the studied single-nucleotide polymorphisms were in Hardy–Weinberg equilibrium (p > 0.05 for all tests). This is an important indicator of the representativeness of the control sample and the absence of significant systematic errors in genotyping. In the group of CAP patients, the situation was different. Statistically significant deviations from the expected Hardy–Weinberg equilibrium were reliably detected for three specific polymorphic markers:
– rs1695 (p.Ile105Val) in the glutathione S-transferase P1 (GSTP1) gene, an enzyme playing a key role in detoxification of reactive oxygen species and xenobiotics;
– rs2069522 (c.-2015T>C) in the promoter region of the cytochrome P450 1A2 (CYP1A2) gene, an important enzyme in the metabolism of various substances, including potentially toxic ones;
– rs17884159 (c.215C>T) in the tumor suppressor p53 (TP53) gene, the “guardian of the genome” that regulates the cell cycle, apoptosis, and the DNA damage response.
The deviations from HWE found exclusively in the CAP group for these specific loci cannot be explained by genotyping artifacts or biased sampling, given that HWE was maintained in the control group for the same markers. Therefore, the most probable causes of these deviations are either the influence of specific environmental factors (e.g., smoking, dietary habits, toxin exposure), which may differentially affect carriers of certain genotypes under chronic inflammation conditions, or selective pressure exerted by the persistent inflammatory process itself in periapical tissues. Such pressure may indirectly affect the viability or reproductive success of carriers of certain genetic variants over time, although this assumption requires further population-genetic studies for confirmation. This result emphasizes the fundamental importance of considering the Hardy–Weinberg equilibrium status, in particular, the detected deviations for GSTP1, CYP1A2, and TP53 gene polymorphisms, when interpreting association and interaction data in the context of CAP [2][16].
Given the limited information that can be obtained from the analysis of individual loci and the high likelihood of complex nonlinear interactions between multiple genetic factors and environmental influences in the development of multifactorial diseases, the Multifactor Dimensionality Reduction (MDR) method was applied to further investigate these relationships in chronic apical periodontitis. MDR is a nonparametric and model-free approach specifically designed to detect and characterize complex higher-order interactions in high-dimensional datasets (with many variables) and limited sample sizes. The method essentially reduces data dimensionality by merging factor level combinations (genotypes, environmental factors) into new binary variables (high/low risk), enabling effective visualization and evaluation of multidimensional interaction patterns.
MDR analysis was sequentially conducted for all studied single-nucleotide polymorphisms and the Disease node, representing a set of environmental factors. This resulted in identifying and characterizing several statistically significant multilocus models describing the joint action of key genes and their interactions with the environment, associated with the risk of CAP development. The process of model construction and validation in MDR includes the following key steps: 1) splitting the dataset into training and testing subsets (cross-validation); 2) evaluating all possible factor combinations (up to the specified interaction order, e.g., two-factor or three-factor models); 3) selecting the optimal factor combination on the training subset; 4) assessing the predictive ability of the selected model on the testing subset. All resulting models were carefully selected and evaluated using strict and transparent criteria.
The main quality criteria in MDR are cross-validation consistency (CVC) and testing balanced accuracy (TBA). CVC reflects how consistently a given combination of factors is selected as the best model across different subsets during cross-validation (maximum value of 10 for 10-fold CV). A high CVC (close to 10) indicates model reliability and reproducibility. TBA is the average of sensitivity (proportion of correctly predicted patients) and specificity (proportion of correctly predicted healthy individuals) in the testing subset. A high TBA value (close to 1.0 or 100%) and correspondingly low prediction error indicate strong predictive power.
In parallel, to assess the informativeness and strength of the identified interactions within the constructed models, the entropy level (I) was evaluated. In information theory, entropy measures the degree of uncertainty or the amount of information contained in an interaction. In MDR analysis, entropy-based evaluation quantifies the contribution of each individual variable (gene, factor) and their pairwise interactions to the overall predictive power of the model. The higher the entropy value for an interaction, the greater its contribution to explaining phenotypic variability (in this case, the risk of CAP). Detailed MDR analysis results, including the best models, their CVC and TBA values, and entropy scores for individual effects and interactions, are presented in Table 3.
Table 3. Characteristics of MDR-models
Таблица 3. Основные характеристики MDR-моделей
|
Model |
CVC |
TBA |
I |
|
rs1143627 × rs1800629 |
9/10 |
73.2 |
4.5% |
|
rs1143627 × rs1800629 × rs17576 |
10/10 |
79.8 |
6.2% |
|
rs1143627 × rs1800629 × rs17576 × rs1107946 |
8/10 |
71.4 |
5.1% |
Note: Table compiled by the author. Abbreviations: rs — reference single nucleotide polymorphism; CVC — cross-validation comparison; TBA — test for balanced accuracy; I — entropy contribution.
Примечание: таблица составлена автором. Сокращения: rs — эталонный однонуклеотидный полиморфизм; CVC — cогласованность перекрестной проверки; TBA — тест сбалансированной точности; I — доля вклада в энтропию.
Basing on the results of MDR analysis and entropy estimates, two types of specialized visualizations were employed to represent the complex structure of the identified relationships between genetic factors and their combinations.
The first visualization was a dendrogram (Fig. 3). This visualization displays the hierarchical structure of connections between various single-nucleotide polymorphisms and their multicomponent combinations. The dendrogram was constructed using an algorithm that takes into account entropy values derived from the MDR analysis. It reveals the “proximity” of factors in their interaction strength related to disease risk. The main information in the dendrogram is presented as nodes (leaves) and branches (lines). Each leaf represents a specific single-nucleotide polymorphism or an environmental factor (in this case, the Disease node). The height of the branches connecting the leaves is a key indicator: it reflects the degree of association (interaction strength) between the corresponding genetic factors. Shorter branches indicate that the SNPs are located close to each other in the interaction hierarchy, suggesting a tighter functional or epistatic relationship between them in CAP pathogenesis. Conversely, longer branches indicate a weaker connection or lack of significant interaction between these factors within the constructed model.
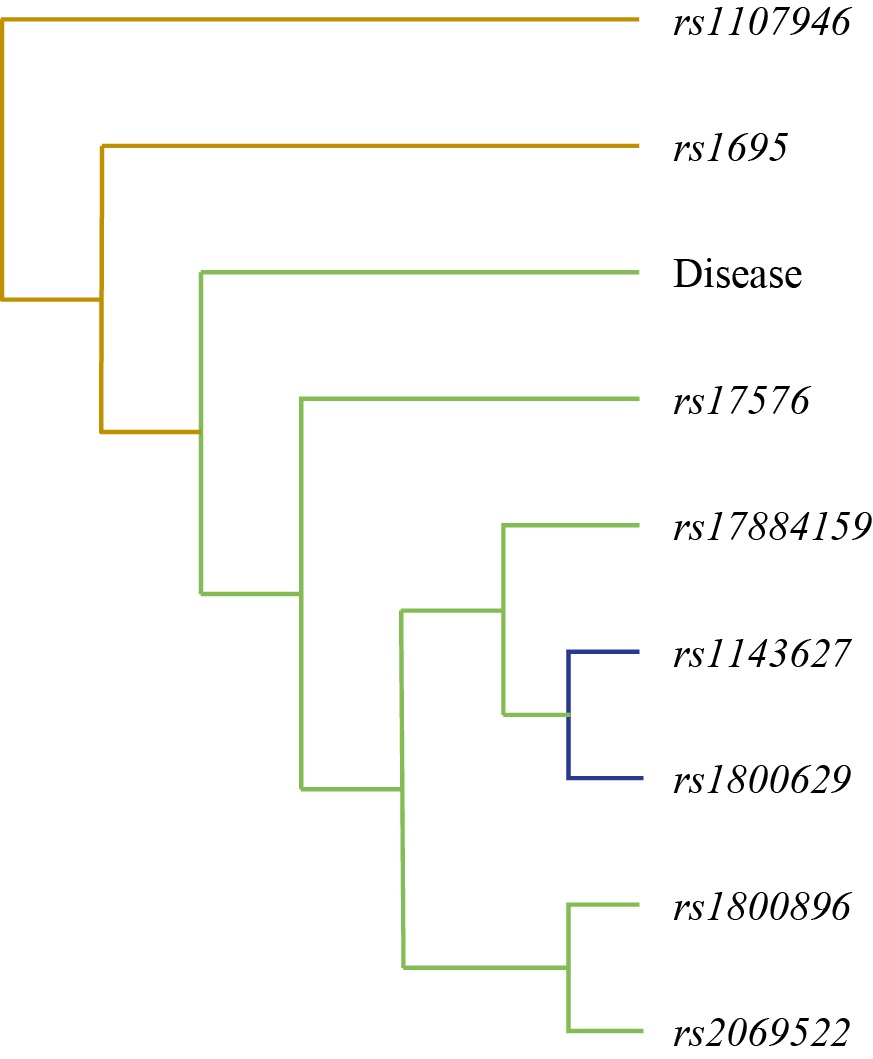
Fig. 3. Tree diagram of gene-environment and gene-gene interaction in chronic apical periodontitis
Note: The figure is made by the author. Tree node labels from top to bottom: rs1107946 (с.1997G>T) COL1A1, rs1695 (p.Ile105Val) GSTP1, Disease, rs17576 (p.Gln279Arg) MMP-9, rs17884159 (с.215C>T) TP53, rs1143627 (с.-31T>C) IL-1β, rs1800629 (c.-308G>A) TNF-α, rs1800896 (c.-1082G>A) IL-10, rs2069522 (с.-2015T>C) CYP1A2. Abbreviation: rs — reference single nucleotide polymorphism.
Рис. 3. Дендрограмма ген-средовых и межгенных взаимодействий при хроническом апикальном периодонтите
Примечания: рисунок выполнен автором; названия узлов, представленных на дендрограмме в последовательности сверху вниз — rs1107946 (с.1997G>T) COL1A1, rs1695 (p.Ile105Val) GSTP1, Disease, rs17576 (p.Gln279Arg) MMP-9, rs17884159 (с.215C>T) TP53, rs1143627 (с.-31T>C) IL-1β, rs1800629 (c.-308G>A) TNF-α, rs1800896 (c.-1082G>A) IL-10, rs2069522 (с.-2015T>C) CYP1A2. Сокращение: rs — эталонный однонуклеотидный полиморфизм.
To depict the nature and direction of the interactions in more detail, a graph of gene–environment and gene–gene connections associated with CAP development was constructed (Fig. 4). This graph visualizes not only the presence of a connection but also its strength, expressed as the proportion of contribution to the total entropy (informative value) of the model. The graph was generated using the Fruchterman–Reingold algorithm, which positions the nodes of the graph (representing genes/SNPs or the Disease factor) on a plane in such a way as to minimize edge crossings and distribute the nodes evenly, attracting related nodes and repelling unrelated ones. The edges of the graph (connections between nodes) may be directed or undirected (depending on the model) and often vary in thickness proportionally to the strength of the interaction (its contribution to entropy). A key advantage of the Fruchterman–Reingold algorithm lies in its ability to handle data “noise” effectively and to visualize even complex graphs containing a large number of nodes and diverse connections, while maintaining relative clarity and interpretability.
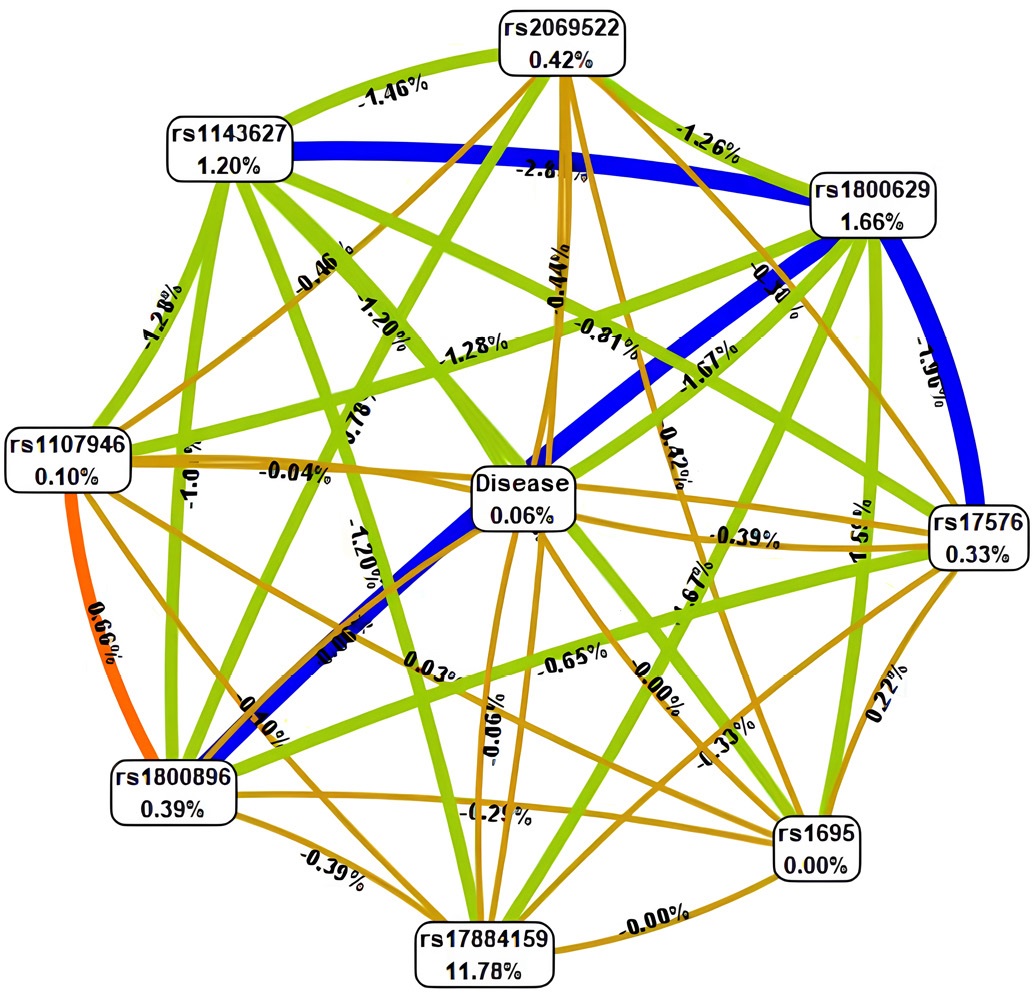
Fig. 4. Gene-gene and gene-environment interactions of polymorphic loci of the analyzed genes in chronic apical periodontitis.
Note: The figure is made by the author. Interactions between candidate genes and the presence of chronic apical periodontitis (Disease) are marked by different color lines: blue stands for pronounced synergism; green represents moderate synergism; orange denotes pronounced antagonism; red moderate antagonism; brown additive interaction. Force and direction of interactions are represented in entropy ratios (%). Abbreviation: rs — reference single nucleotide polymorphism.
Рис. 4. Граф ген-генных и генно-средовых взаимодействий полиморфных локусов изучаемых генов с наличием хронического апикального периодонтита
Примечания: рисунок выполнен автором; направленность взаимодействий между генами-кандидатами и наличием хронического апикального периодонтита (Disease) обозначаются линиями разного цвета: синего — выраженный синергизм, зеленого — умеренный синергизм, оранжевого — выраженный антагонизм, красного — умеренный антагонизм, коричневого — аддитивное взаимодействие. Сила и направленность взаимодействий представлены в % энтропии. Сокращение: rs — эталонный однонуклеотидный полиморфизм.
Thus, Fig. 4 provides a comprehensive graphical representation of the interaction patterns identified through MDR analysis. It demonstrates which genes most closely coordinate their activities with each other and with environmental factors, thereby shaping the predisposition to chronic apical periodontitis (CAP).
The main results described above include the identification of associations for individual polymorphisms, analysis of Hardy–Weinberg equilibrium (HWE), application of the MDR method, and visualization of genetic interactions. The present comprehensive study also explored other potential patterns or significant effects by analyzing allele frequency distributions, searching for subgroup associations (e.g., by sex), and assessing alternative statistical models. However, based on the conducted analyses and applied significance criteria, no additional findings beyond those already reported were identified. All statistically significant associations and interactions have been described in the previous section.
The study identified significant gene–gene interactions associated with the development of chronic apical periodontitis (CAP) using the MDR approach. The three-locus model IL-1β×TNF-α×MMP-9 demonstrated the highest predictive value (balanced accuracy 79.8%, cross-validation consistency 10/10), highlighting the synergistic effects of inflammatory cytokines and proteolytic processes. Analysis of Hardy–Weinberg equilibrium revealed deviations for CYP1A2 and TP53 in the CAP group, suggesting the influence of environmental factors. The Fruchterman–Reingold graph confirmed a strong interaction between IL-1β and TNF-α, while COL1A1 exhibited a moderate connection. These findings point to the multigenic nature of susceptibility to CAP and open avenues for personalized diagnostics and therapy based on combined gene effects.
The analysis was limited to a predefined set of single-nucleotide polymorphisms (SNPs) selected from prior knowledge, and therefore does not encompass all possible genetic variants influencing CAP risk. The relatively small sample size may constrain the statistical power of the study and reduce the detectability of weaker associations. While the MDR method effectively identifies key SNP combinations, understanding the underlying biological mechanisms of these interactions may be challenging.
The results demonstrate the polygenic nature of hereditary predisposition to chronic apical periodontitis, where the combined effects of multiple polymorphisms play a critical role. The most informative model is the three-locus combination IL-1β×TNF-α×MMP-9. It showed perfect cross-validation (10/10) and high balanced accuracy (79.8%). This emphasizes the synergistic role of pro-inflammatory cytokines (IL-1β, TNF-α) and the proteolytic enzyme MMP-9, involved in extracellular matrix and periapical bone destruction. Such synergy aligns with published data on inflammatory periodontal diseases [2][5][7].
Hardy–Weinberg equilibrium analysis confirmed the genetic stability of the control group, validating its representativeness. In the CAP group, deviations were observed for CYP1A2 (rs2069522) and TP53 (rs17884159) (p < 0.001), possibly reflecting the influence of inflammation or exogenous factors affecting xenobiotic metabolism [2][4].
Deviations from HWE in the case group led to similar findings in studies on gene–environment interactions in perinatal complications of gestational diabetes [13], emphasizing shared mechanisms across multifactorial disorders [1][6][17].
The Fruchterman–Reingold graph provided a detailed visualization of gene–gene interaction strength. The thickest (blue) edges represented pronounced synergy between IL-1β and TNF-α, consistent with their central role in initiating inflammatory responses. Green edges (moderate synergy) linked TNF-α with MMP-9, indicating enhanced tissue destruction, whereas orange (antagonistic) edges reflected the anti-inflammatory activity of IL-10, which limits TNF-α overactivation. Brown (additive) edges represented structural genes such as COL1A1, whose influence on inflammation is small compared to that in cytokines. Overall, this visualization confirms that IL-1β–TNF-α synergy is critical to CAP pathogenesis, in agreement with studies on periodontal inflammation [3][8][18].
The three-locus IL-1β×TNF-α×MMP-9 model outperformed both two- and four-locus variants across all metrics (sensitivity 79.8%, specificity 84.4%), making it preferable for clinical application. Its predictive performance is comparable to the ESR1×FSHR×CYP19A1 model used to predict decreased ovarian reserve [11], demonstrating the versatility of MDR analysis in detecting epistatic effects in complex diseases [6][19].
The four-locus IL-1β×TNF-α×MMP-9×COL1A1 model showed reduced predictive value (balanced accuracy 71.4%), likely due to the lesser contribution of COL1A1 to inflammatory response compared to cytokine and metalloproteinase activity [10][11]. Similar tendencies were reported in a study where adding angiogenesis-regulating genes (VEGF-A, eNOS) to the PPARG×eNOS×TCF7L2 model improved sensitivity but complicated interpretation [5].
Of particular note is the paradoxical effect of reduced MMP-9 activity, which theoretically should slow bone resorption but in practice promotes accumulation of damaged proteins and aggravation of inflammation [1][4][20]. This pattern echoes observations where reduced proteolytic activity correlated with increased risk of autoimmune responses [10].
The practical significance of the study lies in the potential to develop personalized diagnostic and therapeutic algorithms for CAP. Genetic screening incorporating SNP combinations (e.g., IL-1β×TNF-α) may enable early identification of high-risk patients. A similar approach is applied in reproductive medicine to predict perinatal complications. Integrating such data into clinical practice could improve treatment outcomes through early intervention and adjustment of risk factors such as xenobiotic metabolism (CYP1A2) or apoptosis regulation (TP53) [1][5].
The findings open perspectives for implementing MDR analysis in dental practice, shifting the approach from population-based to personalized medicine. Future studies should aim to clarify the roles of COL1A1 and TP53 in tissue remodeling and to integrate environmental factors into predictive models to enhance their clinical relevance. Overall, the data confirm that CAP arises from complex gene–gene and gene–environment interactions beyond the reach of classical analytical methods, offering new directions for disease management [2][3][18][20].
The clinical relevance of the three-locus IL-1β×TNF-α×MMP-9 model arises from its ability to account for both inflammatory and tissue-destructive processes, which is crucial for planning comprehensive CAP treatment. Incorporating such insights into dental practice could enhance prognosis, optimize therapy, and reduce the risk of severe disease forms. These findings are consistent with current trends in biomedical research emphasizing a personalized approach that considers combined genetic and environmental effects [1][3][16][18].
The study confirms that chronic apical periodontitis develops through complex gene–gene and gene–environment interactions that cannot be fully captured by classical analytical approaches. The results open perspectives for the introduction of MDR analysis into dental practice, supporting the transition from population-based to personalized medicine. Incorporating such models into clinical practice may improve treatment outcomes through early identification of high-risk patients and correction of risk factors, such as xenobiotic metabolism (CYP1A2) and apoptosis (TP53).
1. Inchingolo F, Martelli FS, Gargiulo Isacco C, Borsani E, Cantore S, Corcioli F, Boddi A, Nguyễn KCD, De Vito D, Aityan SK, Pham VH, Dipalma G, Ballini A. Chronic Periodontitis and Immunity, Towards the Implementation of a Personalized Medicine: A Translational Research on Gene Single Nucleotide Polymorphisms (SNPs) Linked to Chronic Oral Dysbiosis in 96 Caucasian Patients. Biomedicines. 2020;8(5):115. https://doi.org/10.3390/biomedicines8050115
2. Liu X, Li H. A Systematic Review and Meta-Analysis on Multiple Cytokine Gene Polymorphisms in the Pathogenesis of Periodontitis. Front Immunol. 2022;12:713198. https://doi.org/10.3389/fimmu.2021.713198
3. Heidari Z, Moudi B, Mahmoudzadeh-Sagheb H. Immunomodulatory factors gene polymorphisms in chronic periodontitis: an overview. BMC Oral Health. 2019;19:29. https://doi.org/10.1186/s12903-019-0715-7
4. Rudenkova T, Kostiuk S, Poluyan O, Yudina N, Iakovleva-Malykh M. Optimization of molecular biological analysis to identify the nucleotide sequences of the genetic determinants of IL-1β, COL2A1, MMP-8 in patients with periodontal diseases. Sovremennaya Stomatologiya. 2020;3:54–59 (In Russ.).
5. Kriauciunas A, Zekonis G, Liutkeviciene R. Periodontitis association with IL-8 gene polymorphisms. Biomed Pap Med Fac Univ Palacky Olomouc Czech Repub. 2022;166(1):28–39. https://doi.org/10.5507/bp.2021.066
6. Falatah AM, Alturki SA, Aldahami AI, Alrashidi NA, Sinnah Y, Aldgeel RM, Alanazi KZ, Alkhaled AS, ALjuaid TS, Alotaibi NH, Altwijri WJ. Exploring the Influence of Genetic Single-Nucleotide Polymorphism (SNPs) on Endodontic Pathologies: A Comprehensive Review. Cureus. 2024;16(11):e74389. https://doi.org/10.7759/cureus.74389
7. Saremi L, Esmaeili S, Ghaffari ME, Shahbazi S, Lotfipanah S, Kadkhodazadeh M. Evaluation of matrix metalloproteinase-1, -2, -3, -7, and -13 gene polymorphisms in patients with chronic periodontitis and healthy controls. Clin Oral Investig. 2023;27(12):7417–7423. https://doi.org/10.1007/s00784-023-05331-5
8. Yudina N, Iakovleva-Malykh M, Kostiuk S, Rudenkova T. Microbial factor, genetic predisposition and a new classification of periodontal diseases. Sovremennaya stomatologiya. 2021;1:43–50 (In Russ.).
9. da Silva FRP, Pessoa LDS, Shin JI, Alves EHP, Koga RS, Smith CV, Vasconcelos DFP, Pereira ACTDC. Polymorphisms in the interleukin genes and chronic periodontitis: A field synopsis and revaluation by Bayesian approaches. Cytokine. 2021;138:155361. https://doi.org/10.1016/j.cyto.2020.155361
10. Brodzikowska A, Górski B. Polymorphisms in Genes Involved in Inflammation and Periodontitis: A Narrative Review. Biomolecules. 2022;12(4):552. https://doi.org/10.3390/biom12040552
11. Tikhomirova EA. Genetic predictors of periodontitis development: problems and prospects (a literature review). Parodontologiya. 2022;27(1):32–60 (In Russ.). https://doi.org/10.33925/1683-3759-2022-27-1-32-59
12. Kazeko L, Benesh J, Matrix metalloproteinases as a potential diagnostic marker of inflammatory and neoplastic processes in the oral cavity. Sovremennaya stomatologiya. 2019;2:17–20 (In Russ.).
13. Chatterjee S, Rajasekar A. Association Analysis of MMP-13 (rs2252070) Gene Polymorphism and the Susceptibility to Chronic Periodontitis. Cureus. 2024;16(4):e57426. https://doi.org/10.7759/cureus.57426
14. Alotaibi DH, Altalhi AM, Sambawa ZM, Koppolu P, Alsinaidi AA, Krishnan P. The association of matrix metalloproteinase gene polymorphisms and periodontitis: an overview. J Pharm Bioallied Sci. 2020;12(Suppl 1):S37–S42. https://doi:10.4103/jpbs.JPBS_136_20
15. Loka AM, Ponnaiyan D, Parthasarathy H, Tadepalli A, Victor DJ. Association of the CASP3 rs4647602 Gene Polymorphism with Periodontitis in South Indians of Tamil Ethnicity. Genet Test Mol Biomarkers. 2022;26(7-8):391–397. https://doi.org/10.1089/gtmb.2022.0018
16. Sarfaraz D, Karimian M, Farmohammadi A, Yaghini J. The -592C>A variation of IL-10 gene and susceptibility to chronic periodontitis: A genetic association study and in-silico analysis. J Oral Biosci. 2021;63(4):378–387. https://doi.org/10.1016/j.job.2021.09.005
17. Abasijiang A, Lin J, Ma T, Zhao J. Evaluation of the Genetic Association and Methylation of Immune Response Pathway Genes with the Risk of Chronic Periodontitis in the Uighur Population. Genet Test Mol Biomarkers. 2021;25(5):317–324. https://doi.org/10.1089/gtmb.2020.0334
18. Lee CY, Chang CH, Teng NC, Chang HM, Huang WT, Huang YK. Associations between the phenotype and genotype of MnSOD and catalase in periodontal disease. BMC Oral Health. 2019;19(1):201. https://doi.org/10.1186/s12903-019-0877-3
19. Petean IBF, Silva-Sousa AC, Marañón-Vásquez GA, Paula-Silva FWG, Küchler EC, Antunes LS, Segato RAB, da Silva LAB, MazziChaves JF, Lopes-Olhê FC, Sousa-Neto MD. Interaction between polymorphisms in TNF-α and RANKL genes is associated with the development of persistent apical periodontitis, in Brazilian subjects. Arch Oral Biol. 2025;169:106106. https://doi.org/10.1016/j.archoralbio.2024.106106
20. Majumder P, Panda SK, Ghosh S, Dey SK. Interleukin gene polymorphisms in chronic periodontitis: A case-control study in the Indian population. Arch Oral Biol. 2019;101:156–164. https://doi.org/10.1016/j.archoralbio.2019.03.015
Natalya V. Bagryantseva — Dr. Sci. (Med.), Assoc. Prof., Department of Clinical Dentistry and Maxillofacial surgery No 1
Revolutsionnaya St., 5, Yaroslavl, 150000
Bagryantseva N.V. Multilocus models of polymorphic genes and their role in assessing the risk of chronic apical periodontitis: A prospective single-center case control study. Kuban Scientific Medical Bulletin. 2025;32(5):18-31. https://doi.org/10.25207/1608-6228-2025-32-5-18-31
Sedin str. 4, Krasnodar, Russian Federation, 350063
Tel.: (861) 268 55 02
E-mail: kubmedvestnik@ksma.ru, kubmedvestnik@mail.ru


